Fundamental challenges of shore power (OPS)
And how to solve them using our tools (not a sales-pitch)
Onshore Power Supply (OPS) sounds simple: plug ship into socket, turn of engines, problem solved. But if shore power projects were easy, every port would already have them. Instead, developers run into the same fundamental challenges: unpredictable vessel power demand, complex infrastructure decisions, and business cases full of question marks.
In this blog we look at those problems, and how our tools help you tackle them. This is not a sales-pitch (honestly) as all our tools are freely available for you to use. Members do get bonus perks however and get premium features, can download the tools and databases and get extra support from us to solve all these problems. Sign up to the hub and get started today.
(1) Power demand varies significantly and is unique for each ship and port call
→ Sustainable Ships developed a framework to estimate power demand based on 7,000+ ship database
A fundamental problem for developers of shore power or Onshore Power Supply (OPS) infrastructure is the large variability in electrical power demand of ships while at berth. Shore power demand differs significantly by vessel type, size, onboard systems, cargo operations, and operational mode. For example, An LNG carrier during cargo operations (loading/unloading) may draw approximately 6,300 kW, while the same vessel at idle may require only around 600 kW. Measurements made by TNO show that the same container vessel can exhibit up to a 300% variation in power demand under different operational conditions at berth.
In general, auxiliary power demand does not scale consistently with ship size or main engine power, particularly for specific ship categories such as LNG Carriers or Tankers that require a lot of energy at berth when handling cargo. In short, every ship and every port call is unique, which makes it a nightmare to forecast power demand. This variability creates substantial uncertainty in infrastructure design and business case development. Without a structured methodology, average values can be misleading and in some cases dangerous when used for grid sizing or investment decisions.
To deal with this, Sustainable Ships uses a combination of installed auxiliary engine data and measured operational datasets to derive representative low, average, and high demand envelopes per ship category. Auxiliary engine data from more than 7,000 ships with over 150 measured operational datasets or representative values were combined in a single database. The result is a set of scalable relationships between ship size (GT) and representative berth power demand across major ship categories. Developers can quickly estimate realistic low, average, and high demand envelopes, reducing uncertainty in grid connection discussions and early-stage project design. This does not remove uncertainty, but it turns it into something structured and workable for developers, ports, and investors.
(2) No universal definition of ship types
→ Sustainable Ships harmonizes frameworks resulting in clearly defined ship categories, types and sizes
Another fundamental problem in OPS development is that everybody names ships differently. The International Maritime Organization itself states that “there are no universally applicable definitions of ship types,” which sounds harmless until you actually try to compare power demand across studies. One source may classify a vessel as a passenger ship, another as a RoPax Ferry, another as an inland waterways vessel, and yet another may place it in a broader miscellaneous group. The result is that even before discussing average power demand, stakeholders are often not talking about exactly the same ships.
This harmonization also reveals how inconsistent the industry still is. Some sources broadly agree on major groups such as tankers or container ships, while others split categories differently or omit certain vessel types altogether because they fall outside the scope of a regulation or study. The EU, for example, may separate oil and chemical tankers where others simply say “tanker,” while IHS may place entire segments such as dredging or port and tug vessels into miscellaneous categories. In other words, one of the first things needed to make shore power projects easier is not more spreadsheets, but first agreeing on what kind of ship is actually being discussed.
To deal with this, Sustainable Ships developed its own harmonized classification framework by comparing the most commonly used systems, including IMO, EU MRV, IHS, World Ships, and Ship Knowledge by Klaas van Dokkum. IMO and EU classification systems take precedents because they impact compliance and regulatory OPEX. Sustainable Ships’ framework distinguishes clearly between ship category, ship type, and ship size, because each serves a different purpose in modelling. In total, Sustainable Ships uses 20 ship categories and 71 ship types to create a more consistent basis for comparison (at the time of writing this blog). That may sound like a lot, but it is still far better than pretending all sources mean the same thing when they clearly do not.
(3) Different sources, different approaches, different results
→ Sustainable Ships combines several sources and compares them on a GT-basis for comparability
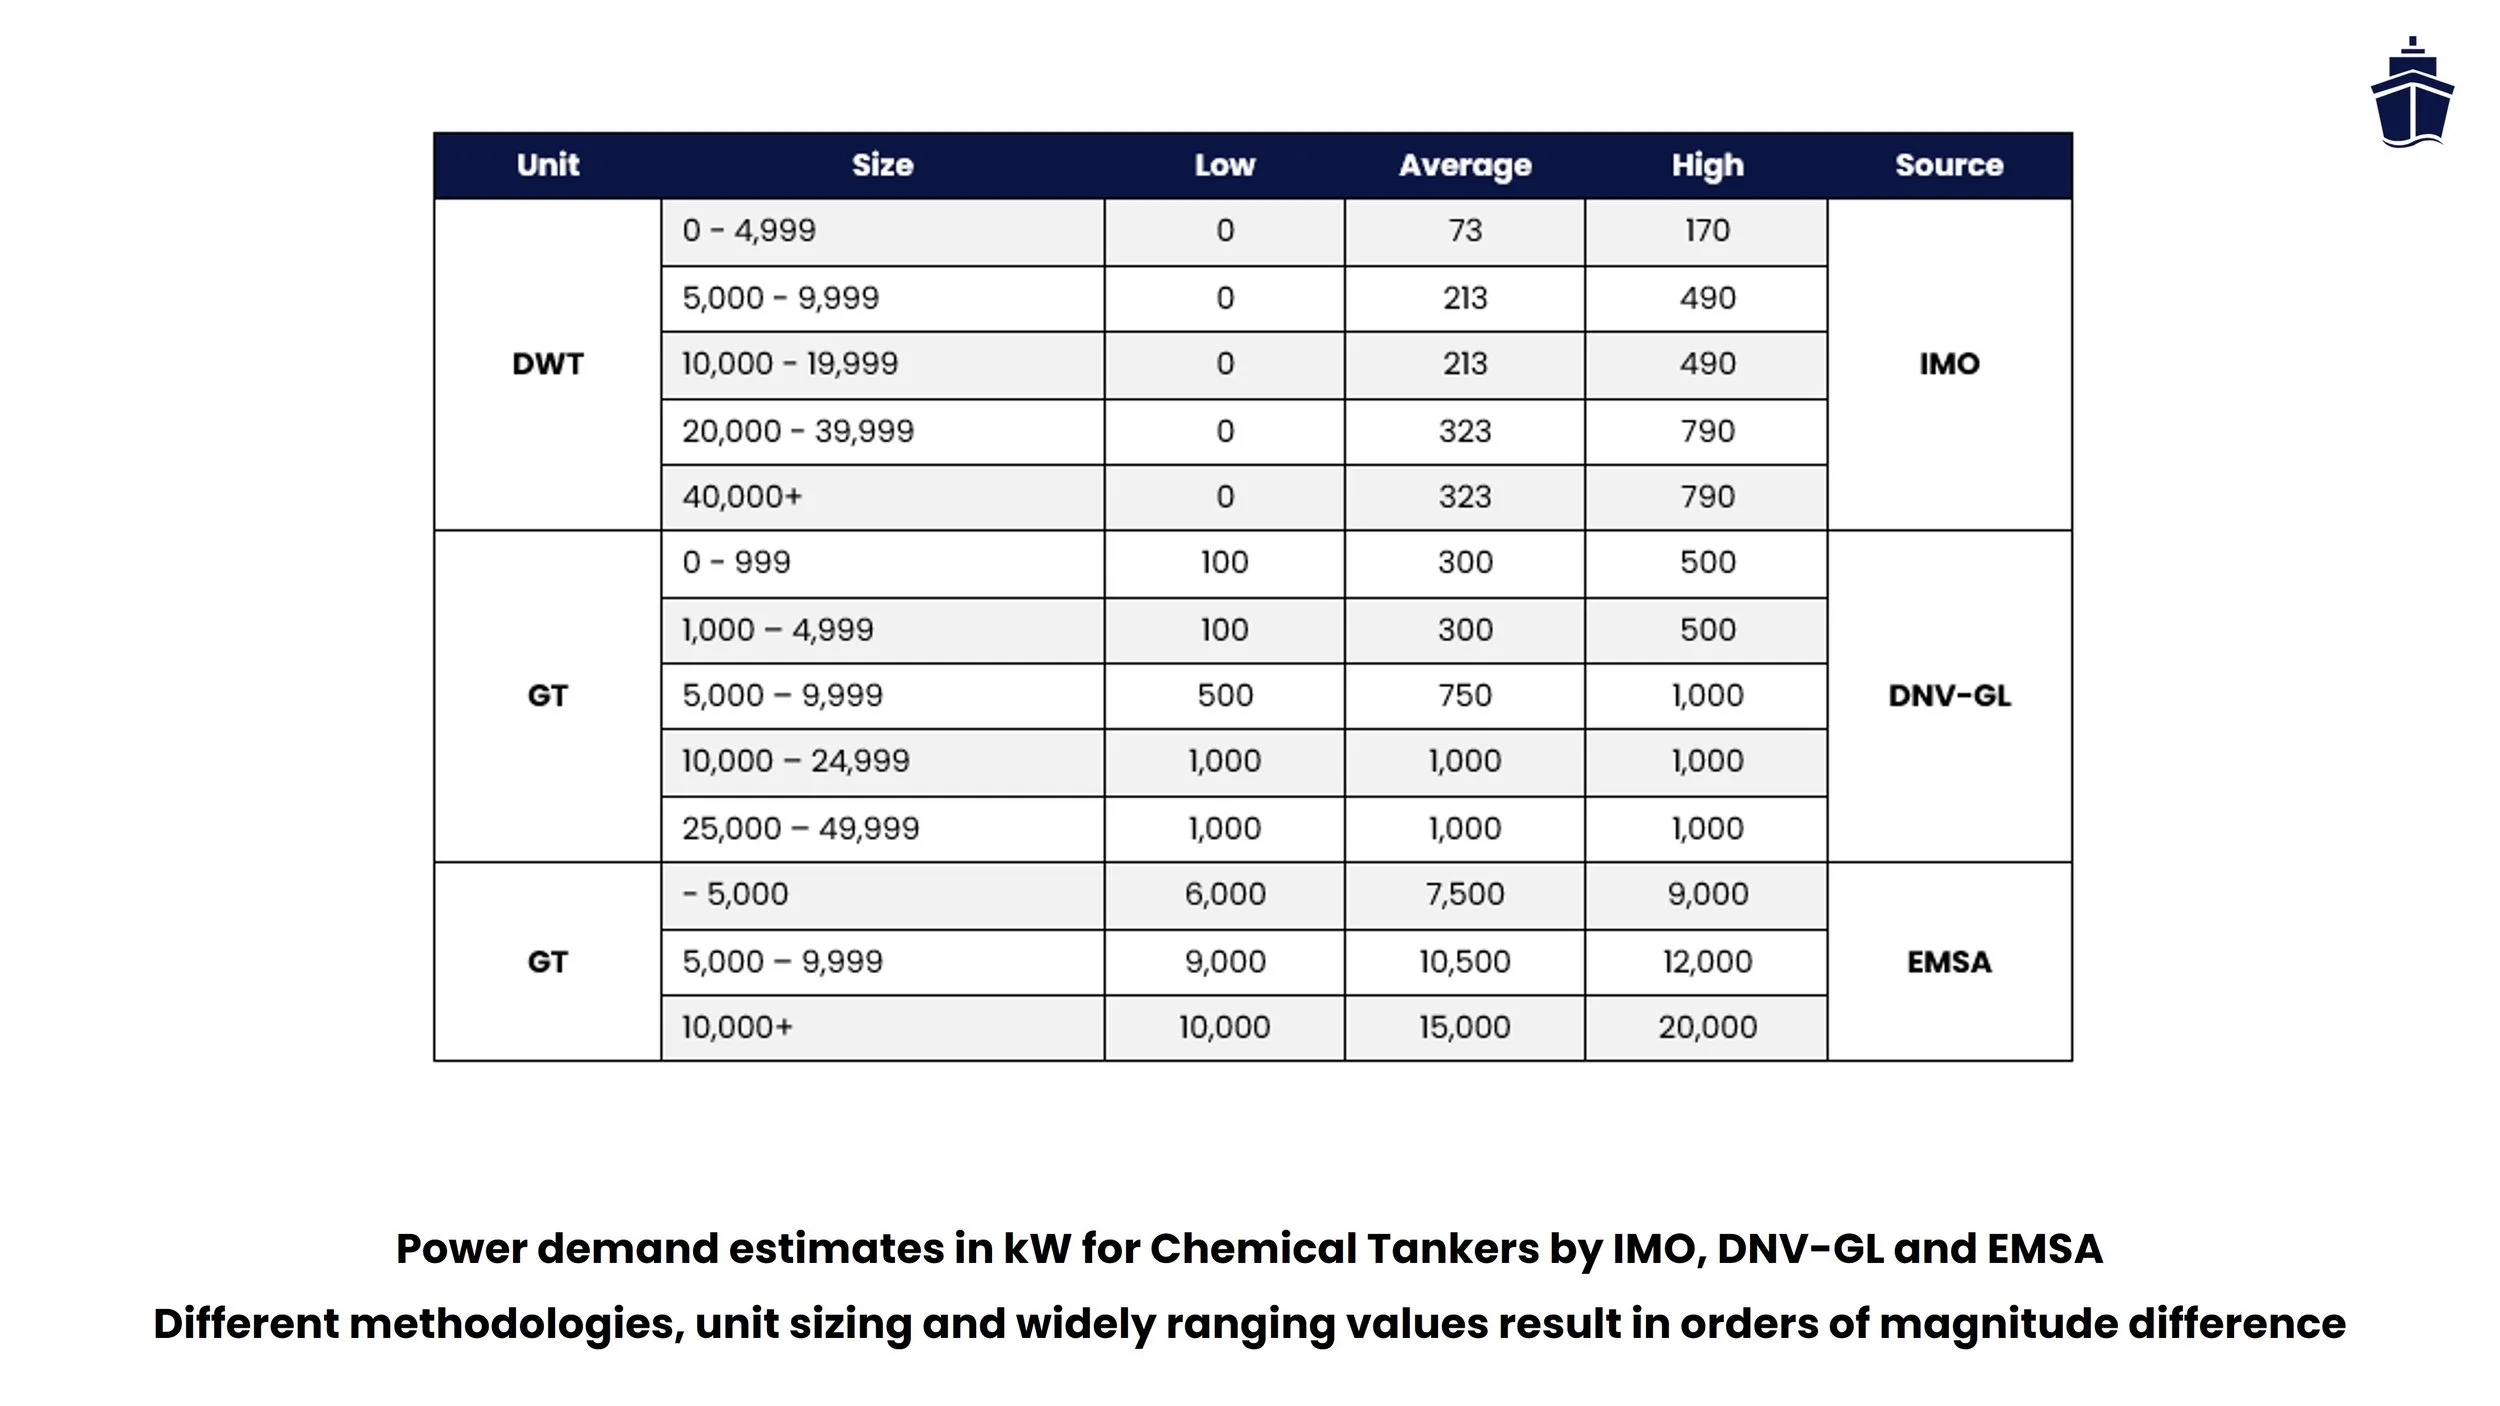
Compounding these issues is the fact that different sources use wildly varying different approaches on determining power demand. Reputable organizations such as the International Maritime Organization (IMO), the European Maritime Safety Agency (EMSA), DNV, and various academic studies use different ship classifications and size parameters, including Gross Tonnage (GT), Deadweight Tonnage (DWT), Twenty-foot Equivalent Units (TEU), and cubic capacity (m3). Units, aggregation methods, and operational assumptions also differ. Some sources provide binned averages by size range (between 1,000 and 5,000 GT for example), others rely on installed auxiliary power, while some derive values from measured time-series data. Survey-based datasets remain the most common basis for estimating auxiliary demand in port emission inventories, but these are often overestimated by the shipowner. These differences in approaches make cross-comparison impossible.
The only practical way around this is to harmonize and benchmark. That is why Sustainable Ships converts different source methods to a common GT-based framework where possible (with GT ‘heuristics’ to estimate GT where it is not known or provided), compares them side by side, and uses measured datasets and representative datapoints to calibrate its own scaling functions. In other words, instead of picking one source and hoping it is right, the aim is to understand the spread, explain the differences, and build a methodology that can actually be defended across multiple sources.
How our tools provide clarity
Sustainable Ships’ tools are at your disposal - both freemium and premium
Understanding the above highlighted problems is thus key in the development of OPS projects. Sustainable Ships provides all the tools needed, in addition to a harmonized framework, to solve all these issues. Below are some of the highlighted tools for you to use. Check the tools section for more (free to use) tools.
Shore Power Quickscan
The Shore Power Quickscan helps you estimate the ship-side economics of shore power in minutes. By combining vessel characteristics, operational patterns, and expected electricity prices, the tool calculates the LCA cost of shore power compared to business as usual (onboard generation of electricity at berth). This allows developers to quickly test whether OPS is economically attractive for specific vessel segments or ports. Instead of long discussions based on assumptions, you can immediately show where shore power makes sense, and where it does not. It is often the fastest way to turn a first conversation into a structured business case.
Average Shore Power Demand Database
One of the biggest uncertainties in OPS development is a simple question: how much power do ships actually need at berth? The Average Shore Power Demand Database addresses this by combining auxiliary engine data from more than 7,000 ships with measured operational datasets. The result is a set of scalable relationships between ship size (GT) and representative berth power demand across major ship categories. Developers can quickly estimate realistic low, average, and high demand envelopes, reducing uncertainty in grid connection discussions and early-stage project design.
Shore Power Terminal Tool
Once ship demand is understood, the next question is: what electricity price makes the infrastructure viable? The Shore Power Terminal Tool translates vessel demand, utilization assumptions, and infrastructure CAPEX/OPEX into a required $/kWh price. This allows developers to test different scenarios for transformer sizes, connection capacity, and utilization rates. The result is a transparent financial model that helps structure discussions with ports, utilities, investors, and customers. In short: it connects technical design decisions directly to project economics.
OPS Connections & Prices Database
OPS projects do not happen in isolation - developers constantly ask what other ports are doing. The OPS Connections & Prices Database provides an overview of existing and planned shore power installations, including technical details, voltage levels, connection types, and where available actual electricity prices or tariffs. This allows developers to benchmark new projects against real market examples and understand how infrastructure is implemented elsewhere. It also helps identify realistic pricing structures and technology choices used across different ports.
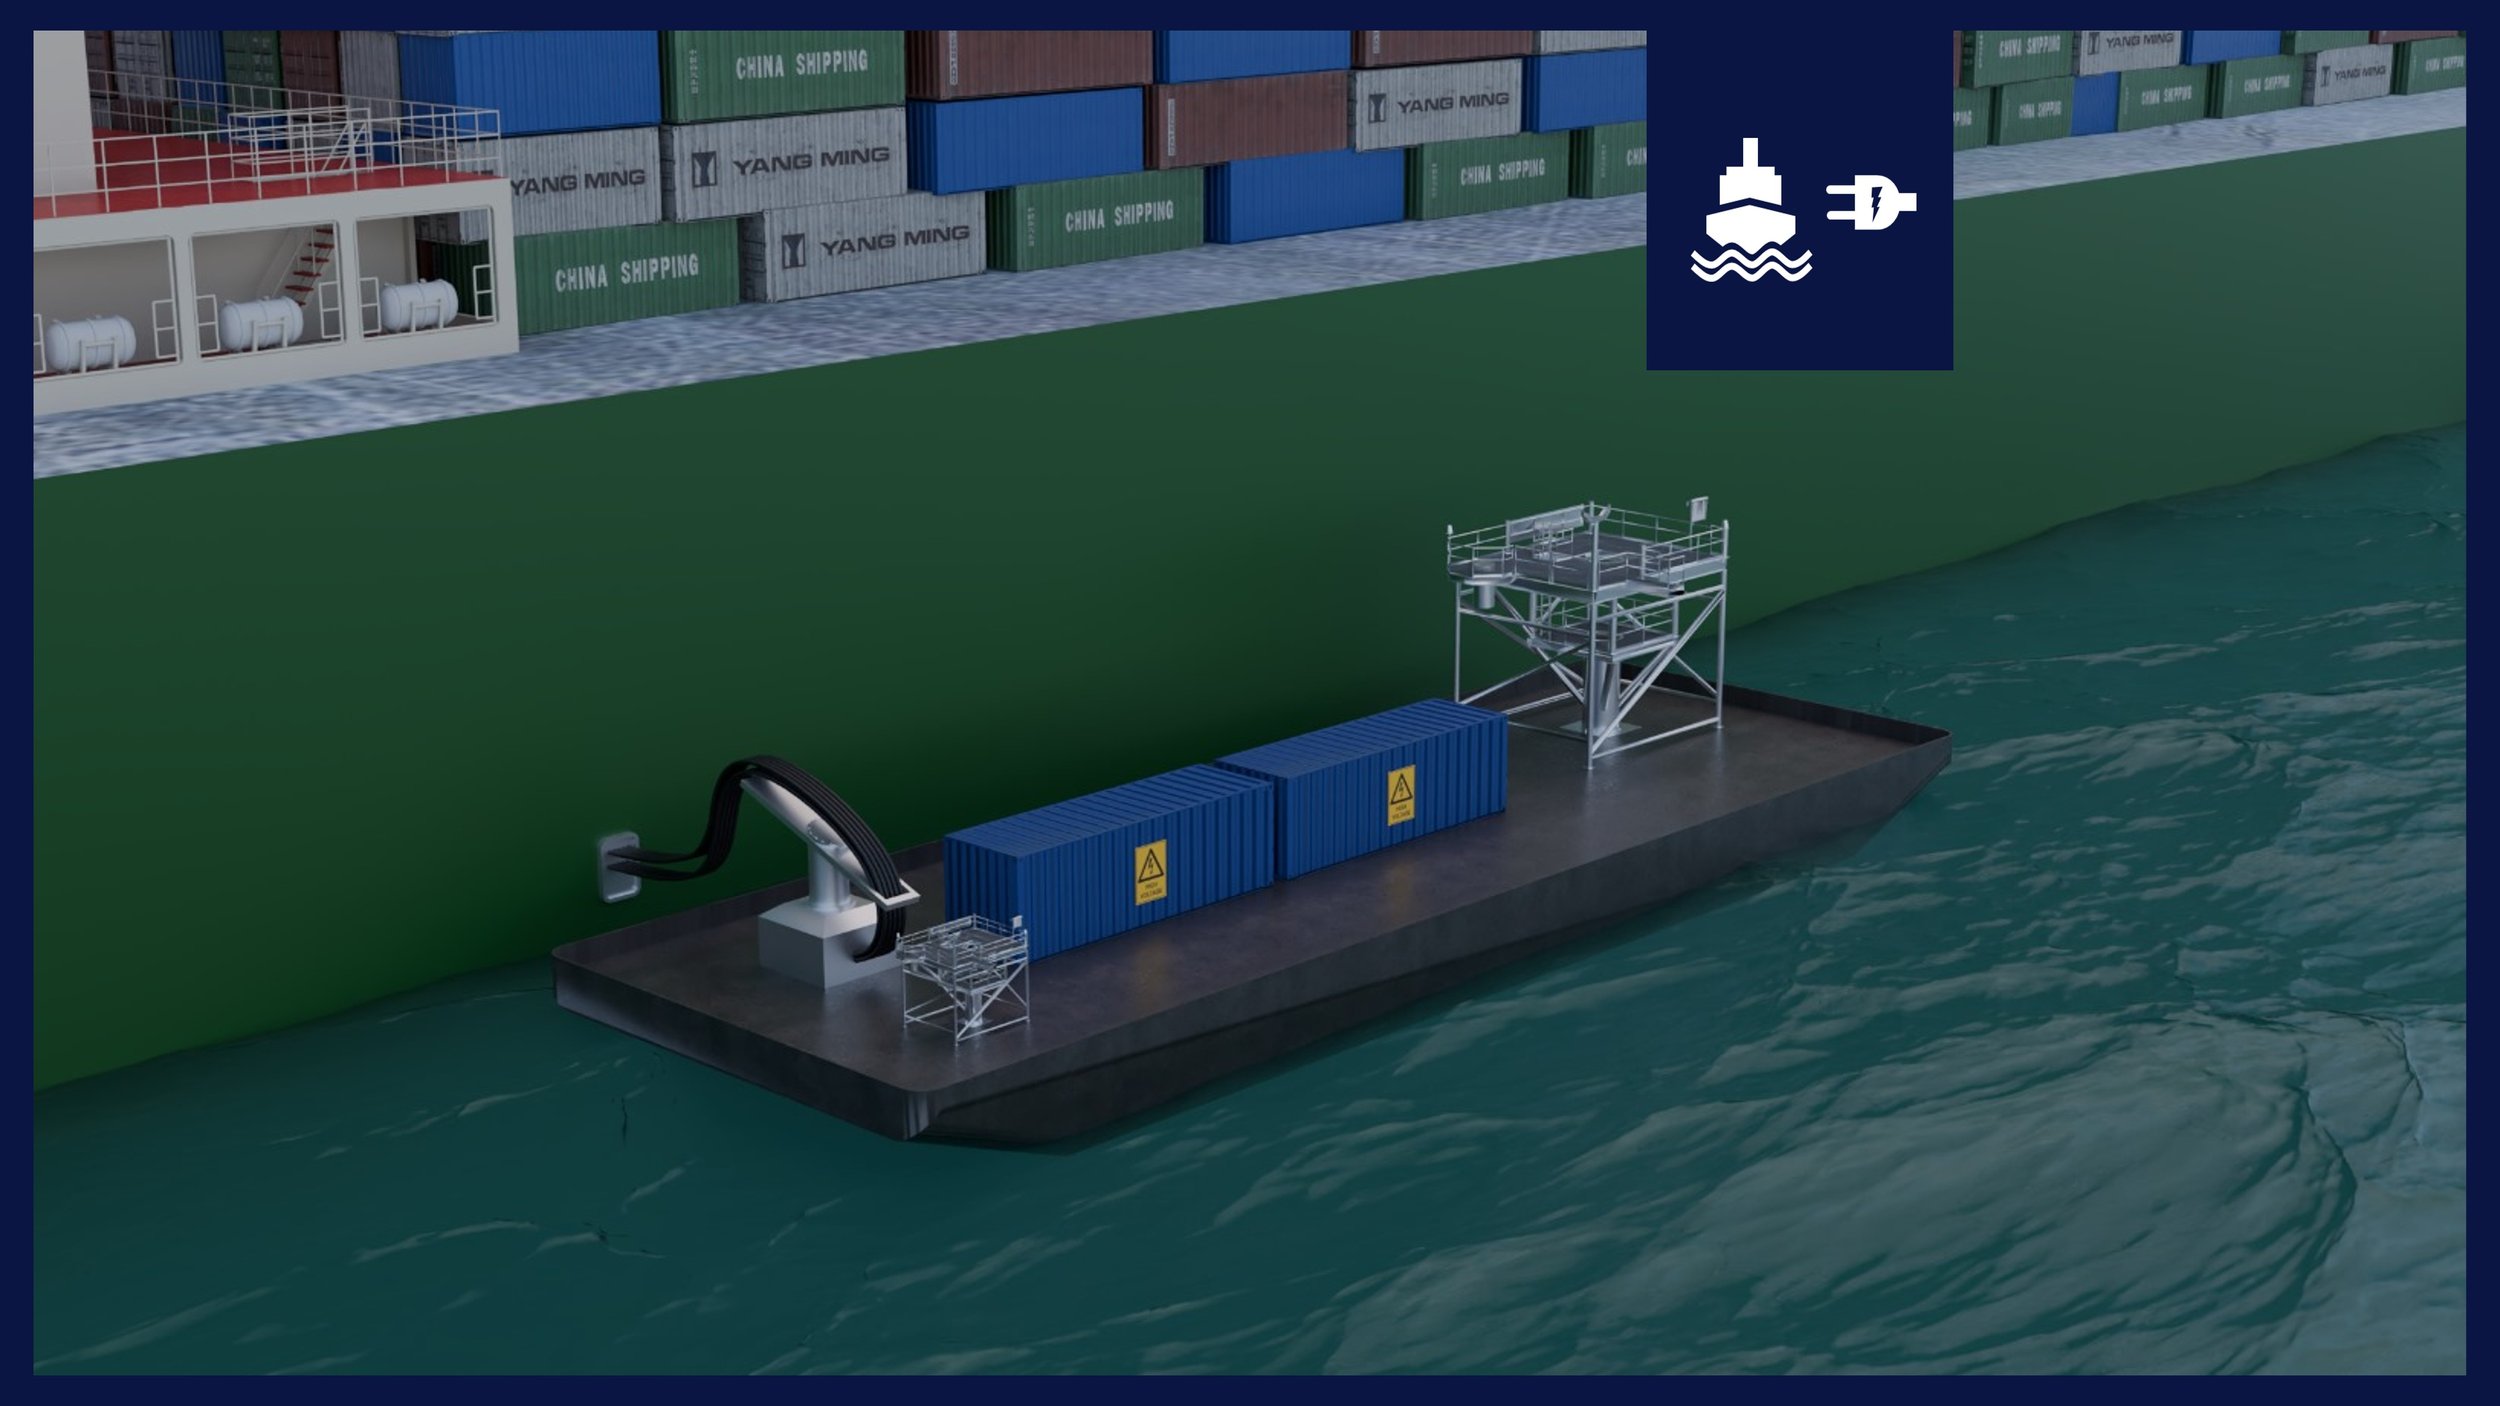
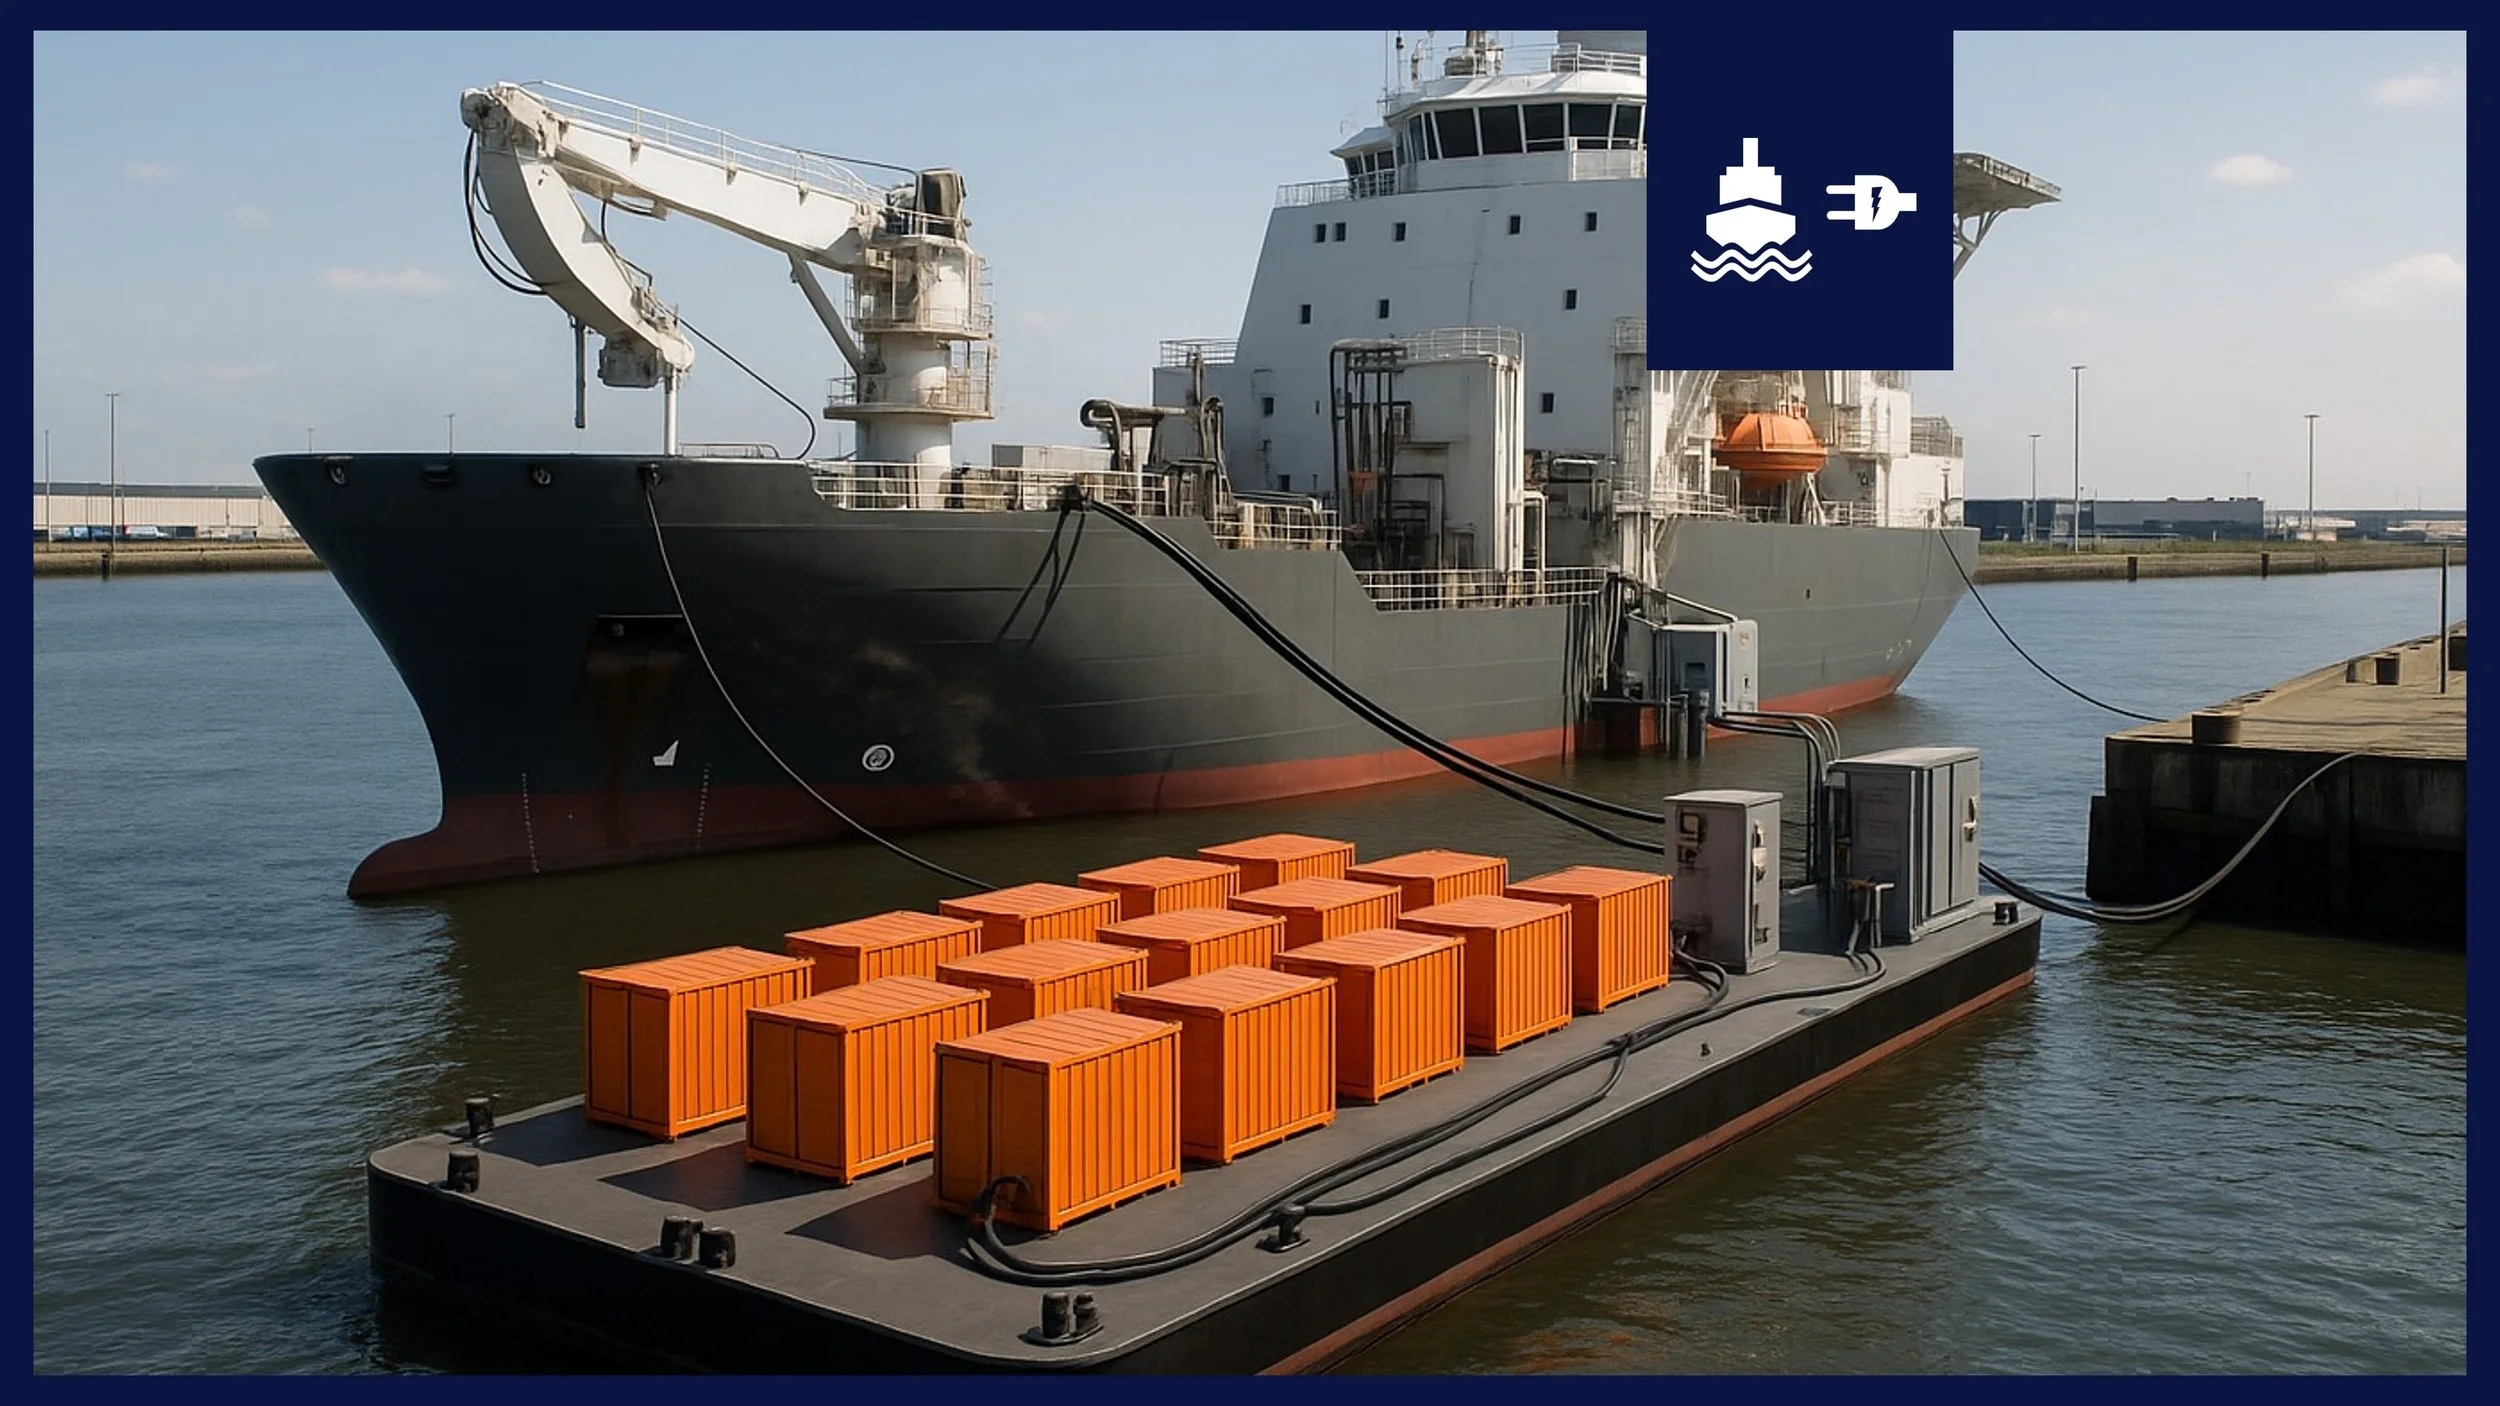
Power Barge / Mobile OPS Concept
Not every port can immediately build large fixed shore power installations. The Power Barge is a flexible, mobile OPS concept as an alternative approach that uses a battery-supported power system. The power barge can provide temporary capacity, serve smaller ports, or bridge the gap while grid connections are upgraded. By modelling these options, developers can evaluate whether flexible or modular OPS solutions could accelerate deployment. Sometimes the fastest way to start electrifying a port is not waiting for the perfect infrastructure.
Premium tools and expert support at your fingertips
This Excel contains a database of almost 7,000 ships with detailed information on the auxiliary engines, backed by studies from IMO, EMSA and DNV-GL. It allows you to understand different shore power requirements for different ships types and sizes. It is meant for suppliers and Port Authorities to be able to understand the power demand estimate shore power infrastructure needs accordingly.
Use Apple Pay to purchase the Excel (only on iPhone) - contact helpdesk for payment by invoice
Don’t want to sign up? Check pay-per-use options