Impact of reefers on container ship power demand
Average power demand increase ≈ 4.38 kW per reefer
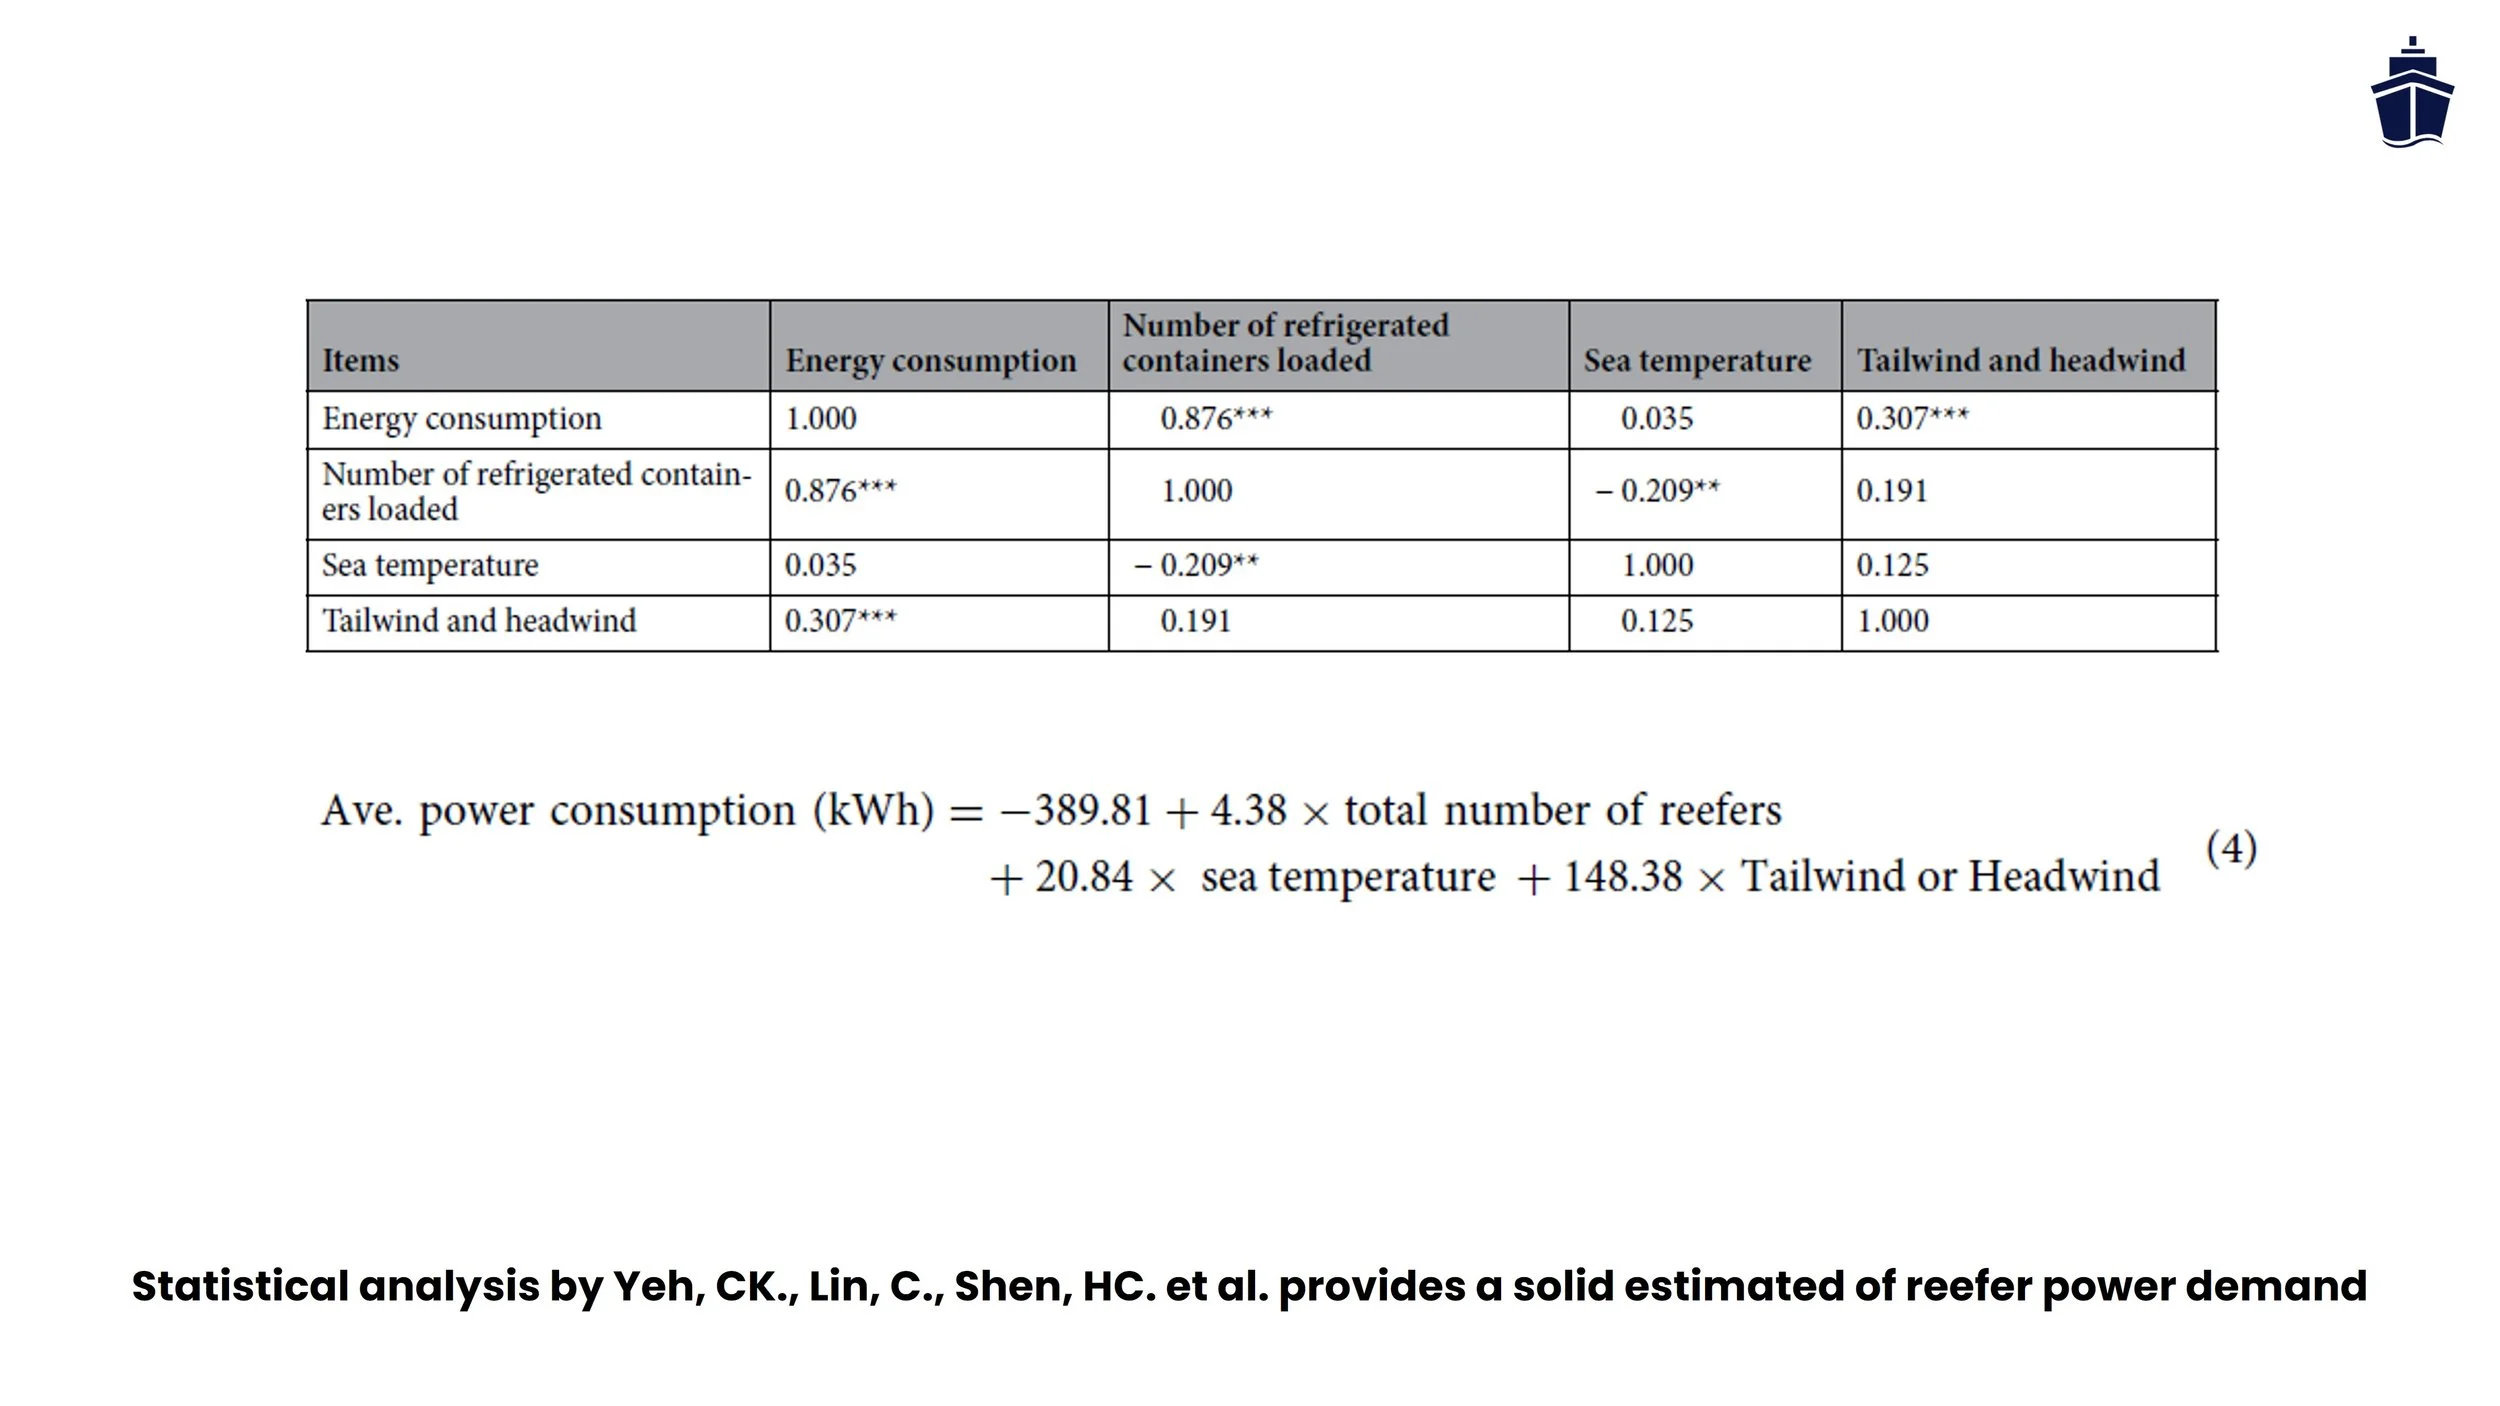
Refrigerated containers (“reefers”) are one of the most significant drivers of berth power demand for container vessels. A 2022 study by by Yeh, CK., Lin, C., Shen, HC. et al. on container ship power consumption in Pacific operations shows that, when wind and sea temperature effects are excluded, energy consumption increases by approximately 4.38 kWh per hour for each additional reefer container loaded onboard. Because the study expresses energy use as hourly average generator output (kWh per hour), this figure directly represents the marginal auxiliary generator load of approximately 4.38 kW per reefer.
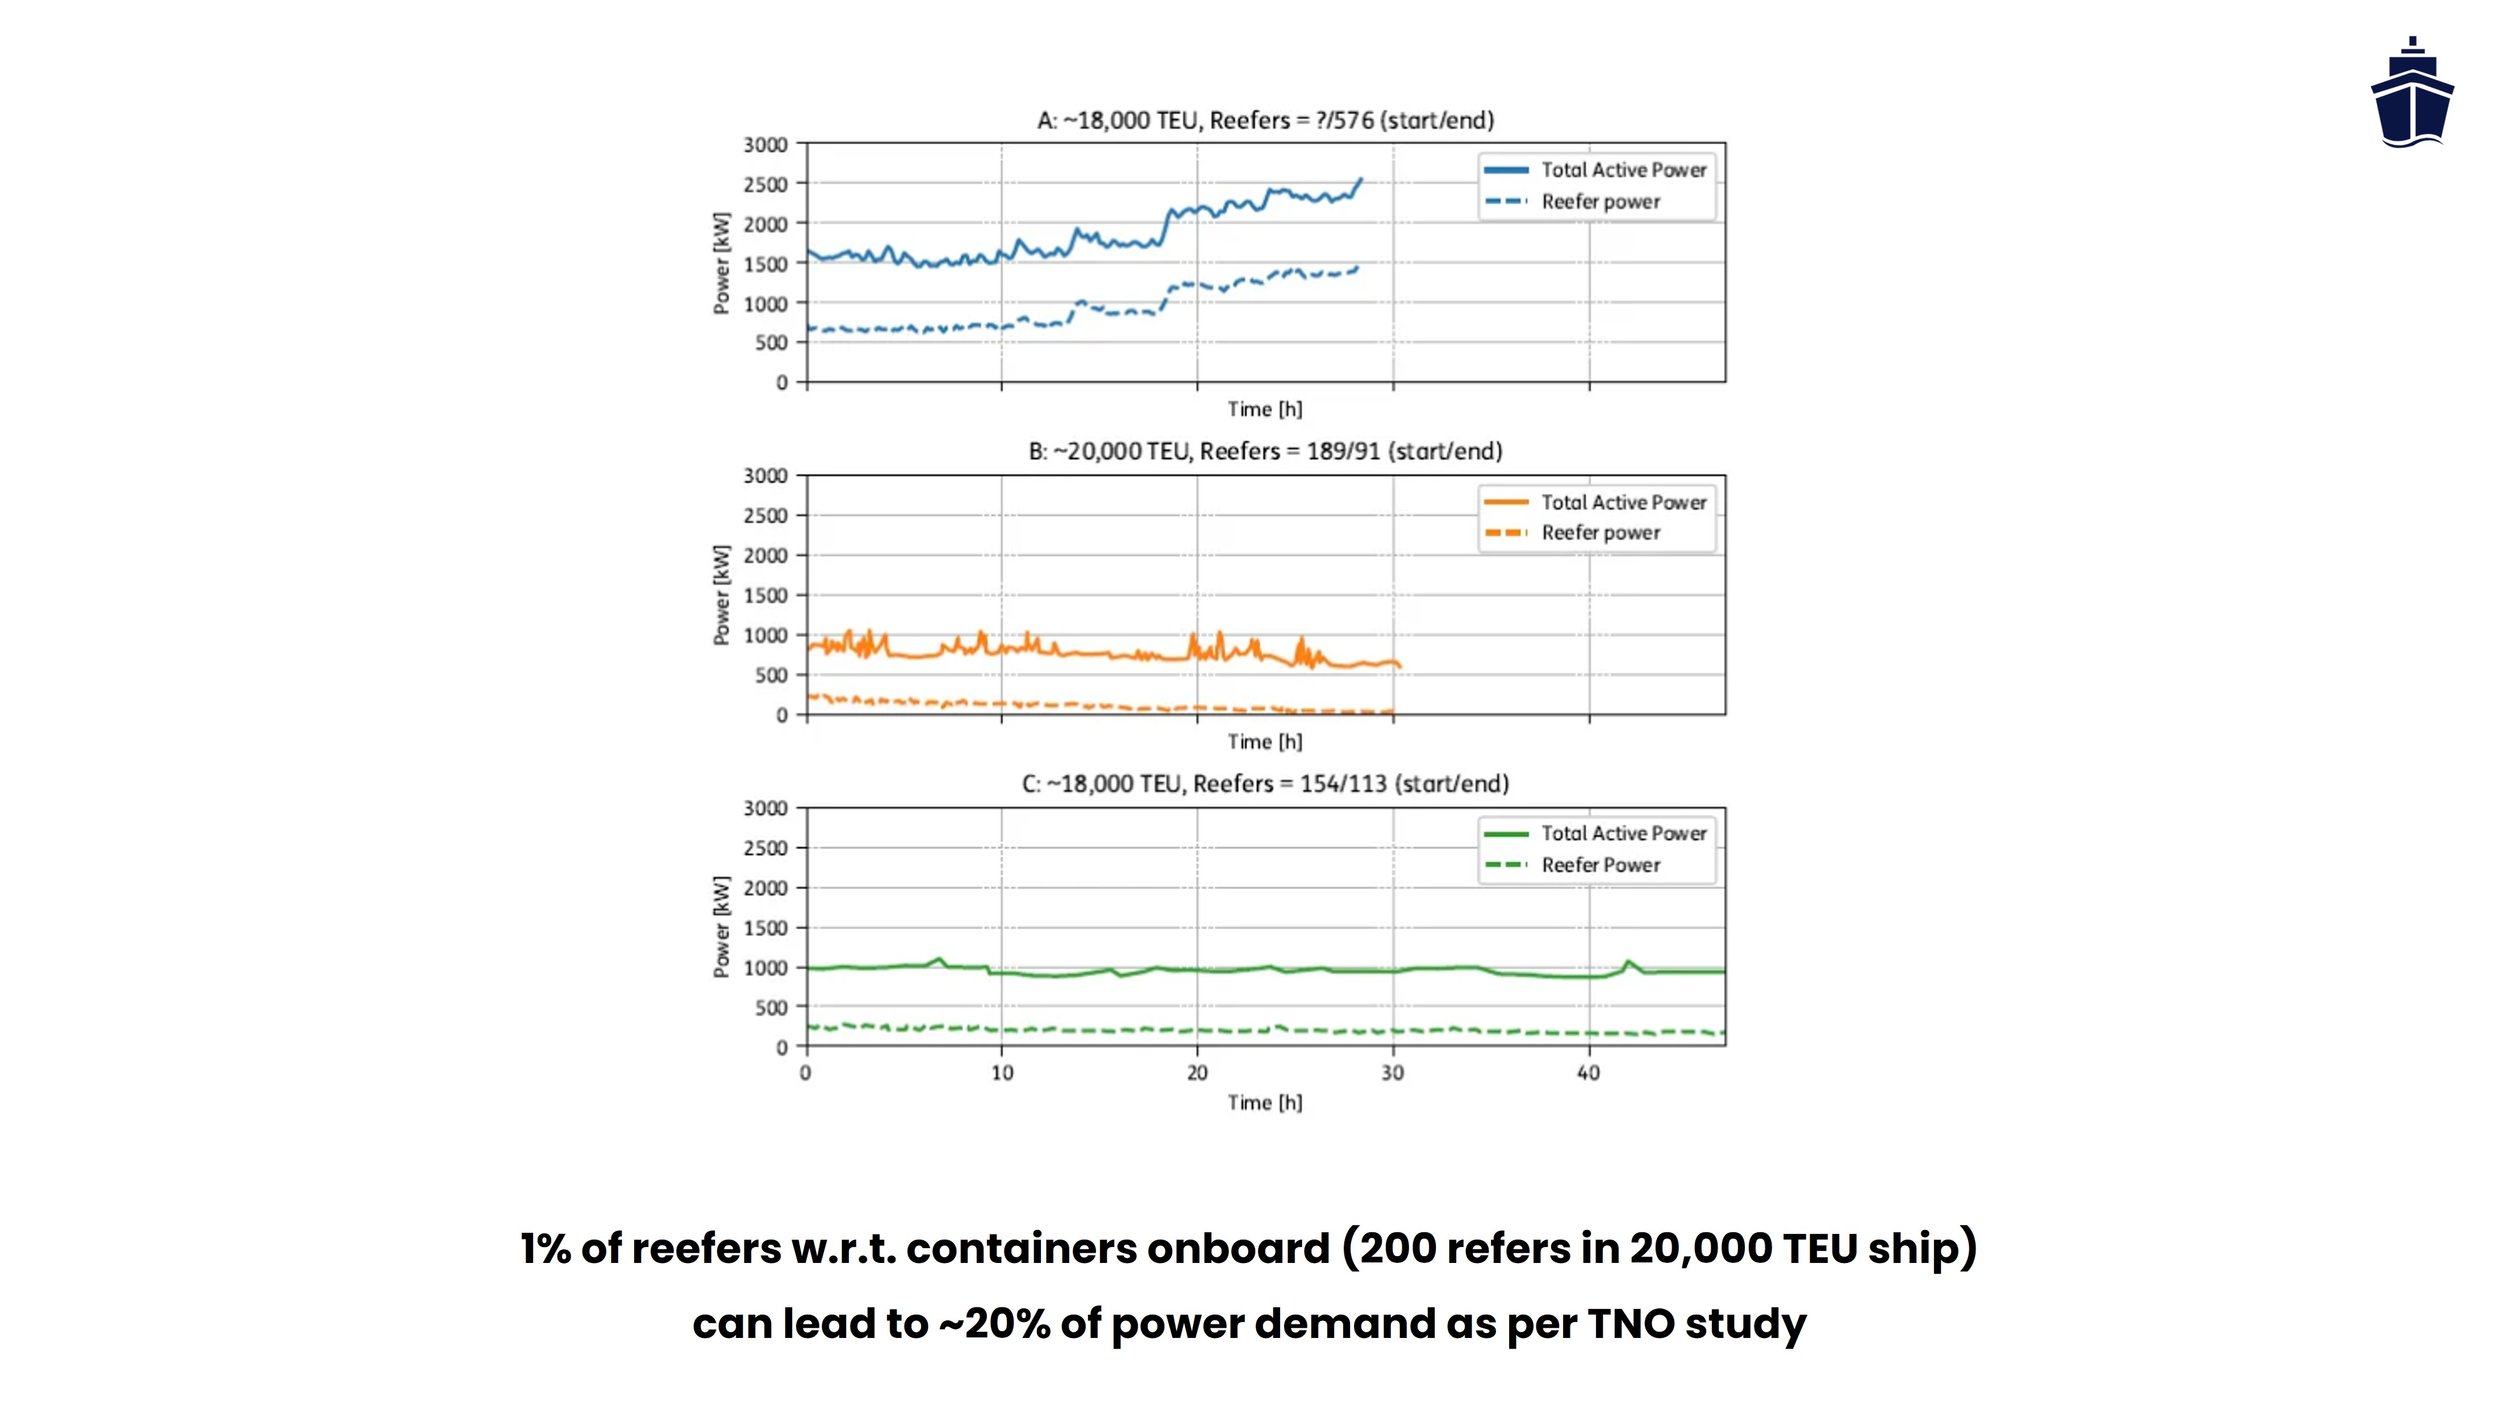
In practical terms, every additional refrigerated container adds a small but structurally consistent electrical demand to the ship’s hotel load. The implication is material: even a relatively small share of reefers can account for a disproportionately large share of total berth power demand. Realtime measurements show that even when 1% of all containers onboard a ship are reefers, it can consume almost 20% of the ship’s total energy demand.
This is reported in a research by TNO, which demonstrated that reefer load is a primary driver of variability in onshore power demand and can explain substantial differences in observed berth consumption for the same vessel under different cargo conditions. For OPS modelling in container ships, reefer share must therefore be treated as a first-order parameter rather than a marginal adjustment.
Explore the results below and sign up to access all premium tools, databases and expert support.
-
If you want to explore challenges related to the average power demand of ships at berth in more detail, the Average Shore Power Demand Guide provides a structured methodology for exactly that.
The guide translates auxiliary engine capacity and measured operational datasets into scalable relationships between ship size (GT) and expected power demand across major ship categories. Rather than relying on generic assumptions, it combines a large ship database, representative measurements, and cross-source benchmarking to derive low, average and high demand envelopes for OPS planning. Inside the guide you will find:
GT-based scaling functions for berth power demand per ship category
Load factor ranges derived from measured datasets and literature
Cross-source comparisons with IMO, DNV and academic studies
Discussion of key uncertainty drivers such as reefer loads, operational modes and ship configuration
Practical guidance for using these estimates in OPS infrastructure sizing and business case development
The result is not a single “correct” number for ship power demand - because such a number does not exist - but a defensible analytical framework that helps developers, ports and investors design shore power projects with greater confidence.
Available for members or pay-per-use
References
Nature.com - Energy Consumption Container Ship Pacific
TNO - Green Deal Validation OPS
Sustainable Ships - Average Shore Power Demand Guide
Downloads available for members and premium users