
What does it cost to generate electricity onboard a ship?
Costs to generate electricity onboard rise from ~$0.20 per kWh (fuel only) to ~$1.00 per kWh with full regulatory exposure in 2040
This blog determines the cost of generating electricity onboard a ship using auxiliary diesel engines. These costs can be used as a benchmark to compare against shore power prices and help shipowners decide when it is more cost-effective to purchase electricity from the grid in port. In addition to bare fuel costs and engine running costs, regulatory exposure costs are included in the analysis, namely EU and UK ETS, FuelEU, IMO Net-Zero.
Results show that fuel costs alone sit around $0.20 per kWh, but once regulatory compliance costs are layered on top, the total effective costs rise sharply to $1.00 per kWh by 2040.
Total costs are heavily dependent on input assumptions on fuel, voyage and operational parameters used. Explore the interactive model below to change these parameters and provide yourself with a sensitivity analysis, and sign up to download the tool and price databases themselves. Members and premium users can readily change, download and adjust all parameters in the model for their own analyses.
Breaking down electricity costs for a shipowner
What are key components for a shipowner to consider and which are most impactful?
Electricity onboard a ship when in port is typically generated by combusting fuel (Marine Diesel or Gas Oil) in auxiliary generators. Historically speaking, due to low fuel prices and no additional taxation or legislation, the resulting costs to generate electricity onboard were low, in the order of $ 0.20 per kWh. With the current legislative train coming up however, electricity costs when combusting fuel are getting more expensive and using onshore power supply (OPS), i.e. purchasing electricity from land-based grid becomes more attractive. To determine when combusting fuel becomes more expensive than purchasing it from the grid, one needs to break down the costs components for combusting fuel onboard in the coming years to understand the costs components, which are Fuel, Maintenance and Consumables, ETS, FuelEU and IMO Net-Zero.
Fuel to generate electricity
Historically the fuel combusted to generate electricity onboard was the only cost component considered (more often than not maintenance and consumables costs are taken for granted). On a pure cost basis, when converting fuel into electricity by means of a typical Specific Fuel Consumption (SFC) ranging between 180 gram per kWh (very efficient) to 240 grams per kWh (more typical for auxiliary engines running at low speed) the costs to produce 1 kWh of energy are typically around $0.20 per kWh. This analysis compares fuel consumption at berth when using conventional fuel (MGO) vs. electricity from shore in order to distinguish FuelEU costs.
Maintenance and consumables
Every hour an engine operates costs money. This engine maintenance costs is primarily consistent of crew man-hours as well as external man-hours (every few thousand running hours an engine needs maintenance from the OEM, Original Engine Manufacturer). On top of maintenance costs, engines consume ‘consumables’, these are lubricants, gaskets, filters, in other wear-and-tear items that are required to keep the engine running. Although this a minor component compared to fuel and compliance costs, these savings can become significant for larger auxiliary engines, particularly those above 2 MW, or when multiple units can be switched off simultaneously. In the case study used in this article, maintenance and consumables costs are negligible.
ETS
The EU and UK Emissions Trading System (EU ETS and UK ETS) are a de facto carbon tax for shipowners, as they directly penalize CO₂ emissions on a Tank-to-Wake basis. Costs for EU ETS at the time of writing are approximately €300 per ton of fuel consumed (assuming ~ €75 per allowance). ETS is a rather simple system when compared to FuelEU or IMO Net-Zero, and for this analysis only the fuel (or rather emissions) saved at berth incur cost savings, as fuel consumed while sailing is unaffected by shore power.
FuelEU
FuelEU Maritime is a complicated regulation that has come into effect in 2025, with quite some incentives (and sticks) when it comes to shore power. Compliance costs are based on the vessel’s annual Well-to-Wake GHG intensity, which includes energy use while sailing and mooring. Because shore power improves this annual GHG intensity, savings will be incurred for the entire year and over all operational modes, including sailing. Because it is an EU regulations only 50% of energy of voyages coming from and to the EU are taken into account. This means that the ship itinerary and port calls heavily affect the outcome of FuelEU penalties and thus electricity costs onboard. Of all the cost components, FuelEU and IMO Net-Zero are typically the most significant ones.
IMO Net-Zero
If IMO’s global Net-Zero framework comes into force in 2029, which is still uncertain at the time of writing, shipowners will be confronted with a mechanism similar to FuelEU. GHG intensity is calculated on an annual basis and shipowners above defined thresholds are penalized. In this analysis, IMO Net-Zero costs are assumed to stack on top of FuelEU, although discussions are ongoing about harmonisation between the two regulations. Until these are fixed or more about them is known, IMO Net-Zero is considered a significant cost component when it comes to onboard electricity generation.
Break-even price of onboard electricity vs. electricity from the grid
At what price level does shore power actually become cost-effective compared to burning fuel onboard?
This question is the critical benchmark for shipowners and ports alike: the price point below which plugging in saves money, above which costs are incurred. Understanding this price point gives shipowners a clear reference when negotiating electricity tariffs in port or with terminal operators.
The break-even price has historically been around $0.20 per kWh, which is the typical cost of producing electricity with auxiliary engines burning marine fuel. Maintenance and consumables costs are typically not significant when compared to this price point (~ $0.03 per kWh) but it depends on ship type and operational profile. The decisive shift comes with upcoming regulations that introduce compliance penalties, i.e. ETS (EU or UK), FuelEU and IMO Net-Zero.
As a rule of thumb, EU regulations are expected to double the break-even price for shore-side electricity by 2030, and nearly triple it by 2040 when IMO Net-Zero penalties are layered on top. This means that even if the cost of electricity in port approaches $1.00 per kW, shore power remains the cheaper option compared to burning conventional fuels.
The key insight is that fuel-only onboard power is a misleading benchmark. Once you add the regulatory and operational layers that shipowners will face over time (IMO Net-Zero, FuelEU Maritime, EU ETS) as well as auxiliary engine maintenance, the effective cost of onboard generation rises sharply. In other words, what looks like “cheap electricity generated onboard” becomes substantially more expensive once the full compliance and operating cost stack is internalised. This trajectory can then be used as the decision line: OPS below that level improves the shipowner’s cost position; OPS above it risks deterring uptake, even in a world where regulatory pressure is pushing vessels to connect.
-
Ship operating in ARA region using marine diesel oil (MDO) for auxiliary engines.
Electricity generation converted from fuel consumption using reasonable engine load, SFC, and fossil LCV values as per FuelEU.
Fuel price MGO = $ 1,000 per mT and HFO = $ 750.
Fuel price escalation: 0% indexation.
A constant USD/EUR exchange rate of 1.15 is assumed for the modelling period.
EU ETS applied to emissions at berth only, with 7% annual indexation of EUA.
FuelEU Maritime costs calculated on full-year Well-to-Wake GHG intensity.
IMO Net-Zero costs assumed stacked on top of FuelEU (no harmonisation).
Auxiliary engine maintenance costs are $ 25 per running hour and $ 2.50 per running hour for consumables.
OPS prices across EU for comparison
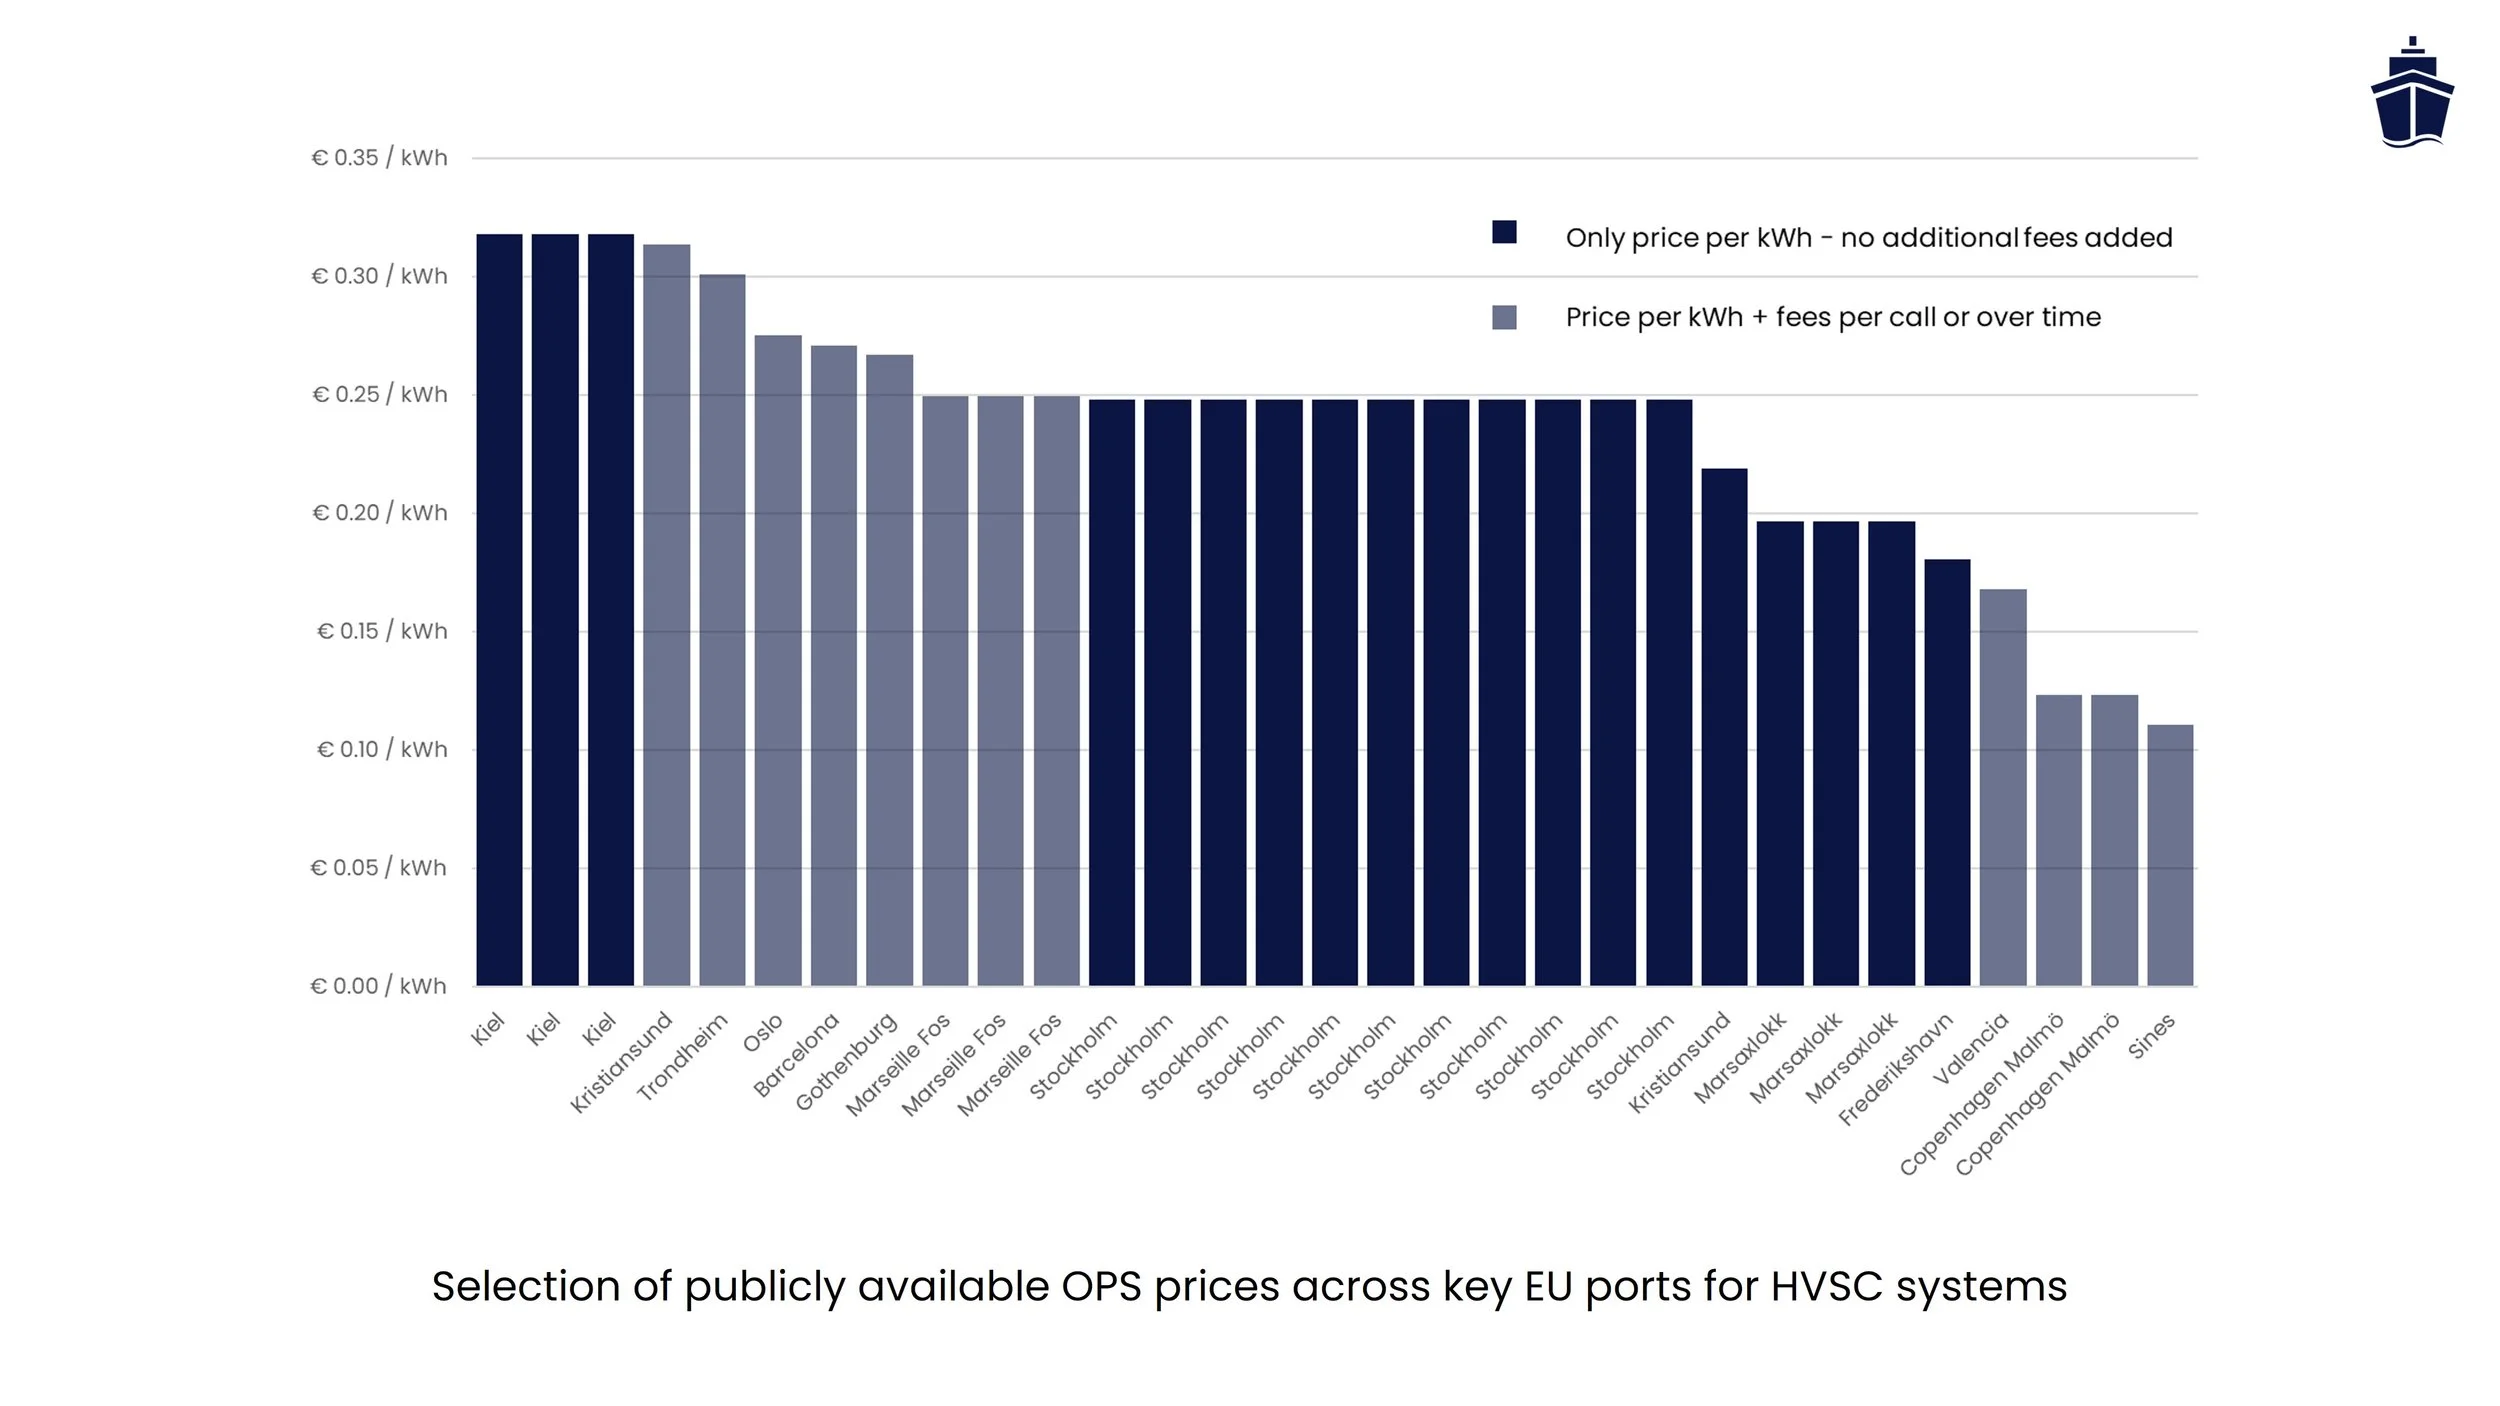
Recent study by Sustainable Ships reveals that average OPS price is ~€0.25 per kWh in EU
How does the costs of generating electricity compare to the costs for purchasing electricity from the grid in the EU? The below chart shows publicly available prices at different EU ports to provide a benchmark. There is wide dispersion in observable €/kWh values, driven not only by national electricity fundamentals but also by differences in grid tariff structures, fiscal treatment (including cases where Member States apply reduced electricity taxation for shore-side supply), and how ports choose to recover infrastructure costs under uncertain utilisation.
The figure therefore distinguishes between ports that present OPS as a pure volumetric price (€/kWh only) and those that combine a €/kWh charge with fixed fees per call or over time. For benchmarking and “reasonableness” checks, the defensible approach is to compare ports on (1) price model and transparency (what is fixed, what is variable, what is pass-through), (2) evidence quality (published tariffs vs secondary reporting vs negotiated), and (3) expected utilisation and load profiles, rather than relying on a single €/kWh figure.
Nonetheless these numbers - subject to change! - provide some indication of what a shipowner can currently expect for major ports in the EU. Check the latest prices and updates in the OPS Connections and Prices Database.
Methodology and assumptions
All modelling and analyses are based on the Shore Power Quickscan. This tool calculates the total lifecycle operating cost (LCA) of a ship while running on auxiliary generators at berth (conventional) and while using shore power (shore power). The user can freely select the cost components for the analysis, including CAPEX, fuel, electricity and regulatory exposure of a vessel. To determine these costs, the ship’s yearly energy consumption and compliance obligations are calculated on a yearly basis for both the conventional and shore power case. Costs while moored and while sailing are calculated, as shore power usage affects the GHG intensity of the ship over the entire year, thereby changing regulatory compliance costs for sailing as well. Calculations are done as follows. To unlock the full premium analysis, explore detailed assumptions, run personalized scenarios, or access our cost-benefit model to run your own, become a member.
-
In the current model, only a single fuel type can be selected for the sailing and mooring operational mode. Main fuel used for this analysis is LFO, auxiliary fuel is MDO. It is assumed the main engine is used fully for sailing, aux. engine is used while mooring. All fuel savings are due to shutting off the aux. engine while mooring, therefore all fuel savings are incurred onto the auxiliary fuel consumption. Fuel consumption while mooring is calculated by multiplying the amount of aux. engines with engine load, maximum rated power and Specific Fuel Consumption (SFC) of the engine. Further specifications or multi-fuel options (for example Methanol and MDO in a dual fuel engine) can be done on a case-by-case basis.
-
A single fuel price constant over time is taken into account for this analysis: $500 per mT for LFO and $750 per mT for MDO. No indexation is included for this analysis, but these can be included by the user to include inflation, simulate the forecasts as provided by third parties, etc..
-
European Allowances (EUA) are assumed €75 for 2026 and UK Allowances (UKA) £ 55. Both increase 7% per annum to reflect the rise of ETS costs expected by the market.
-
Each fuel is defined by its Lower Calorific Value (LCV) and emission factors, including CO₂, CH₄, and N₂O. Both Tank-to-Wake and Well-to-Wake intensities are included. These are used to calculate energy content, emissions, and compliance intensity per MJ or per tonne. EU ETS, FuelEU and IMO adhere to different emission factors and LCV values, which should be checked especially in the case when biofuels are used.
-
This analysis does not include the additional OPS penalty for the shipowner described in the FuelEU regulation of €1.5 per kW for non-compliant port calls. This clause is included to ensure that shipowners will comply and actually use shore power during a port call, provided of course that infrastructure is available. When assuming an average power demand of 600 kW for containerships (used in the case study further along the article) the penalty would result in a daily fine of €21.600. This clause would basically make writing this article obsolete, considering the costs involved would make plugging in a no-brainer.
-
FuelEU also allows for surplus units to be generated through over-compliance, which can be pooled across fleets or traded, potentially creating additional revenue streams. This mechanism is excluded from the current analysis but could become an important factor for large operators managing diverse fleets.
Sign up for premium tools and benefits

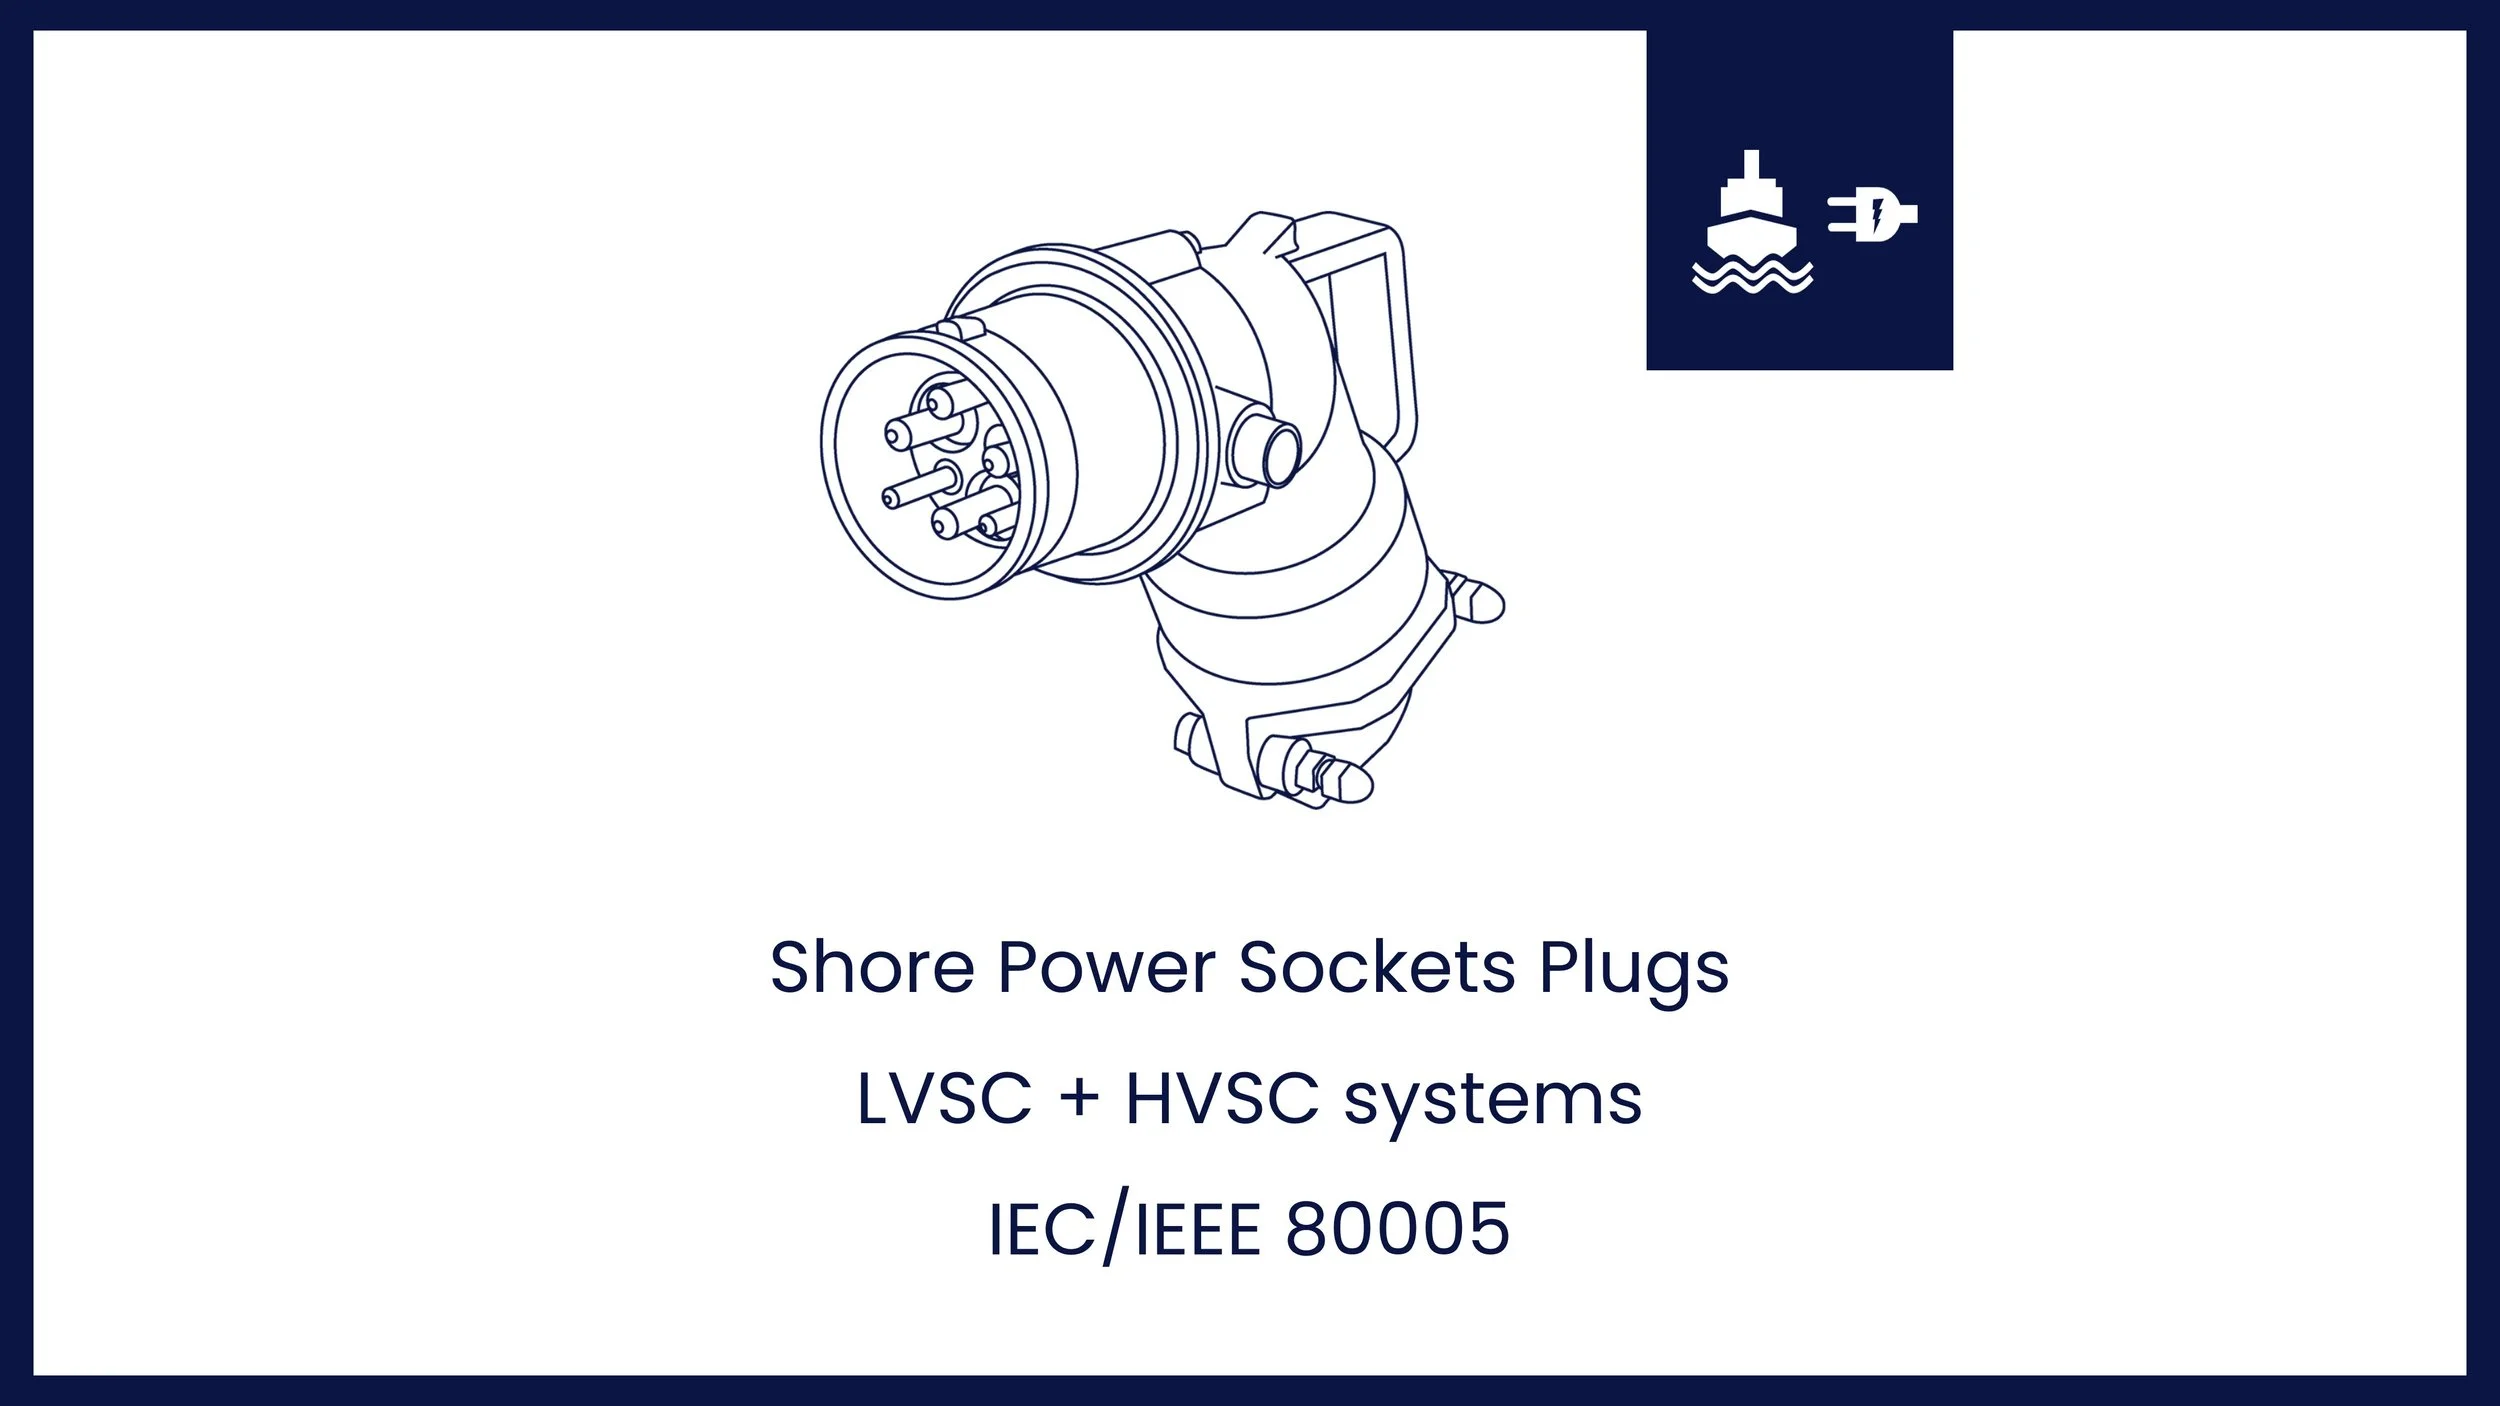
The Shore Power Quickscan is a comprehensive tool designed to provide a business case for a shore power refit onboard vessels, based on IEC/IEEE 80005. It includes CAPEX estimates, operational expenses including fuel costs and engine maintenance, emissions savings as well as key regulations such as FuelEU and EU ETS. This purchase allows you to store your calculations, work offline anywhere, plus print a comprehensive techno-economic feasibility that you can show off to friends or your management.
Use Apple Pay to purchase the Excel (only on iPhone) - contact helpdesk for payment by invoice
Don’t want to sign up? Check pay-per-use options
References
Sustainable Ships - Shore Power Quickscan
Sustainable Ships - OPS Connections and Prices Database
Sustainable Ships - FuelEU Maritime
Sustainable Ships - EU ETS
Sustainable Ships - IMO Net-Zero Framework
EU - Thetis MRV
EU - Trans-European Transport Network (TEN-T)
ICCT - Shore power needs and CO2 emissions reductions of ships in EU ports
You might also like


This case study determines the cost of generating electricity onboard a ship using auxiliary diesel engines to determine when it is more cost-effective to purchase electricity from the grid in port. Results show that fuel costs alone sit around $0.20 per kWh, but once regulatory compliance costs are layered on top, the total effective costs rise sharply to $1.00 per kWh by 2040.