
Average Shore Power Demand Masterclass
The methodology behind estimating average shore power demand per ship category, for ports, terminals and OPS developers
Average shore power demand is the holy grail of OPS development. Every business case, every grid connection request and every transformer specification depends on one number: how much power will the ships actually draw at berth. It is also the number nobody can give you with confidence.
The same vessel can vary by up to 300% during a port call. Two sister ships doing the same job can differ by 30%. Tankers of the same type and size can differ tenfold in installed auxiliary capacity. And the main published sources (IMO, DNV and EMSA) disagree with each other by a factor of three or more, because they use different ship classifications, different size parameters and different bands.
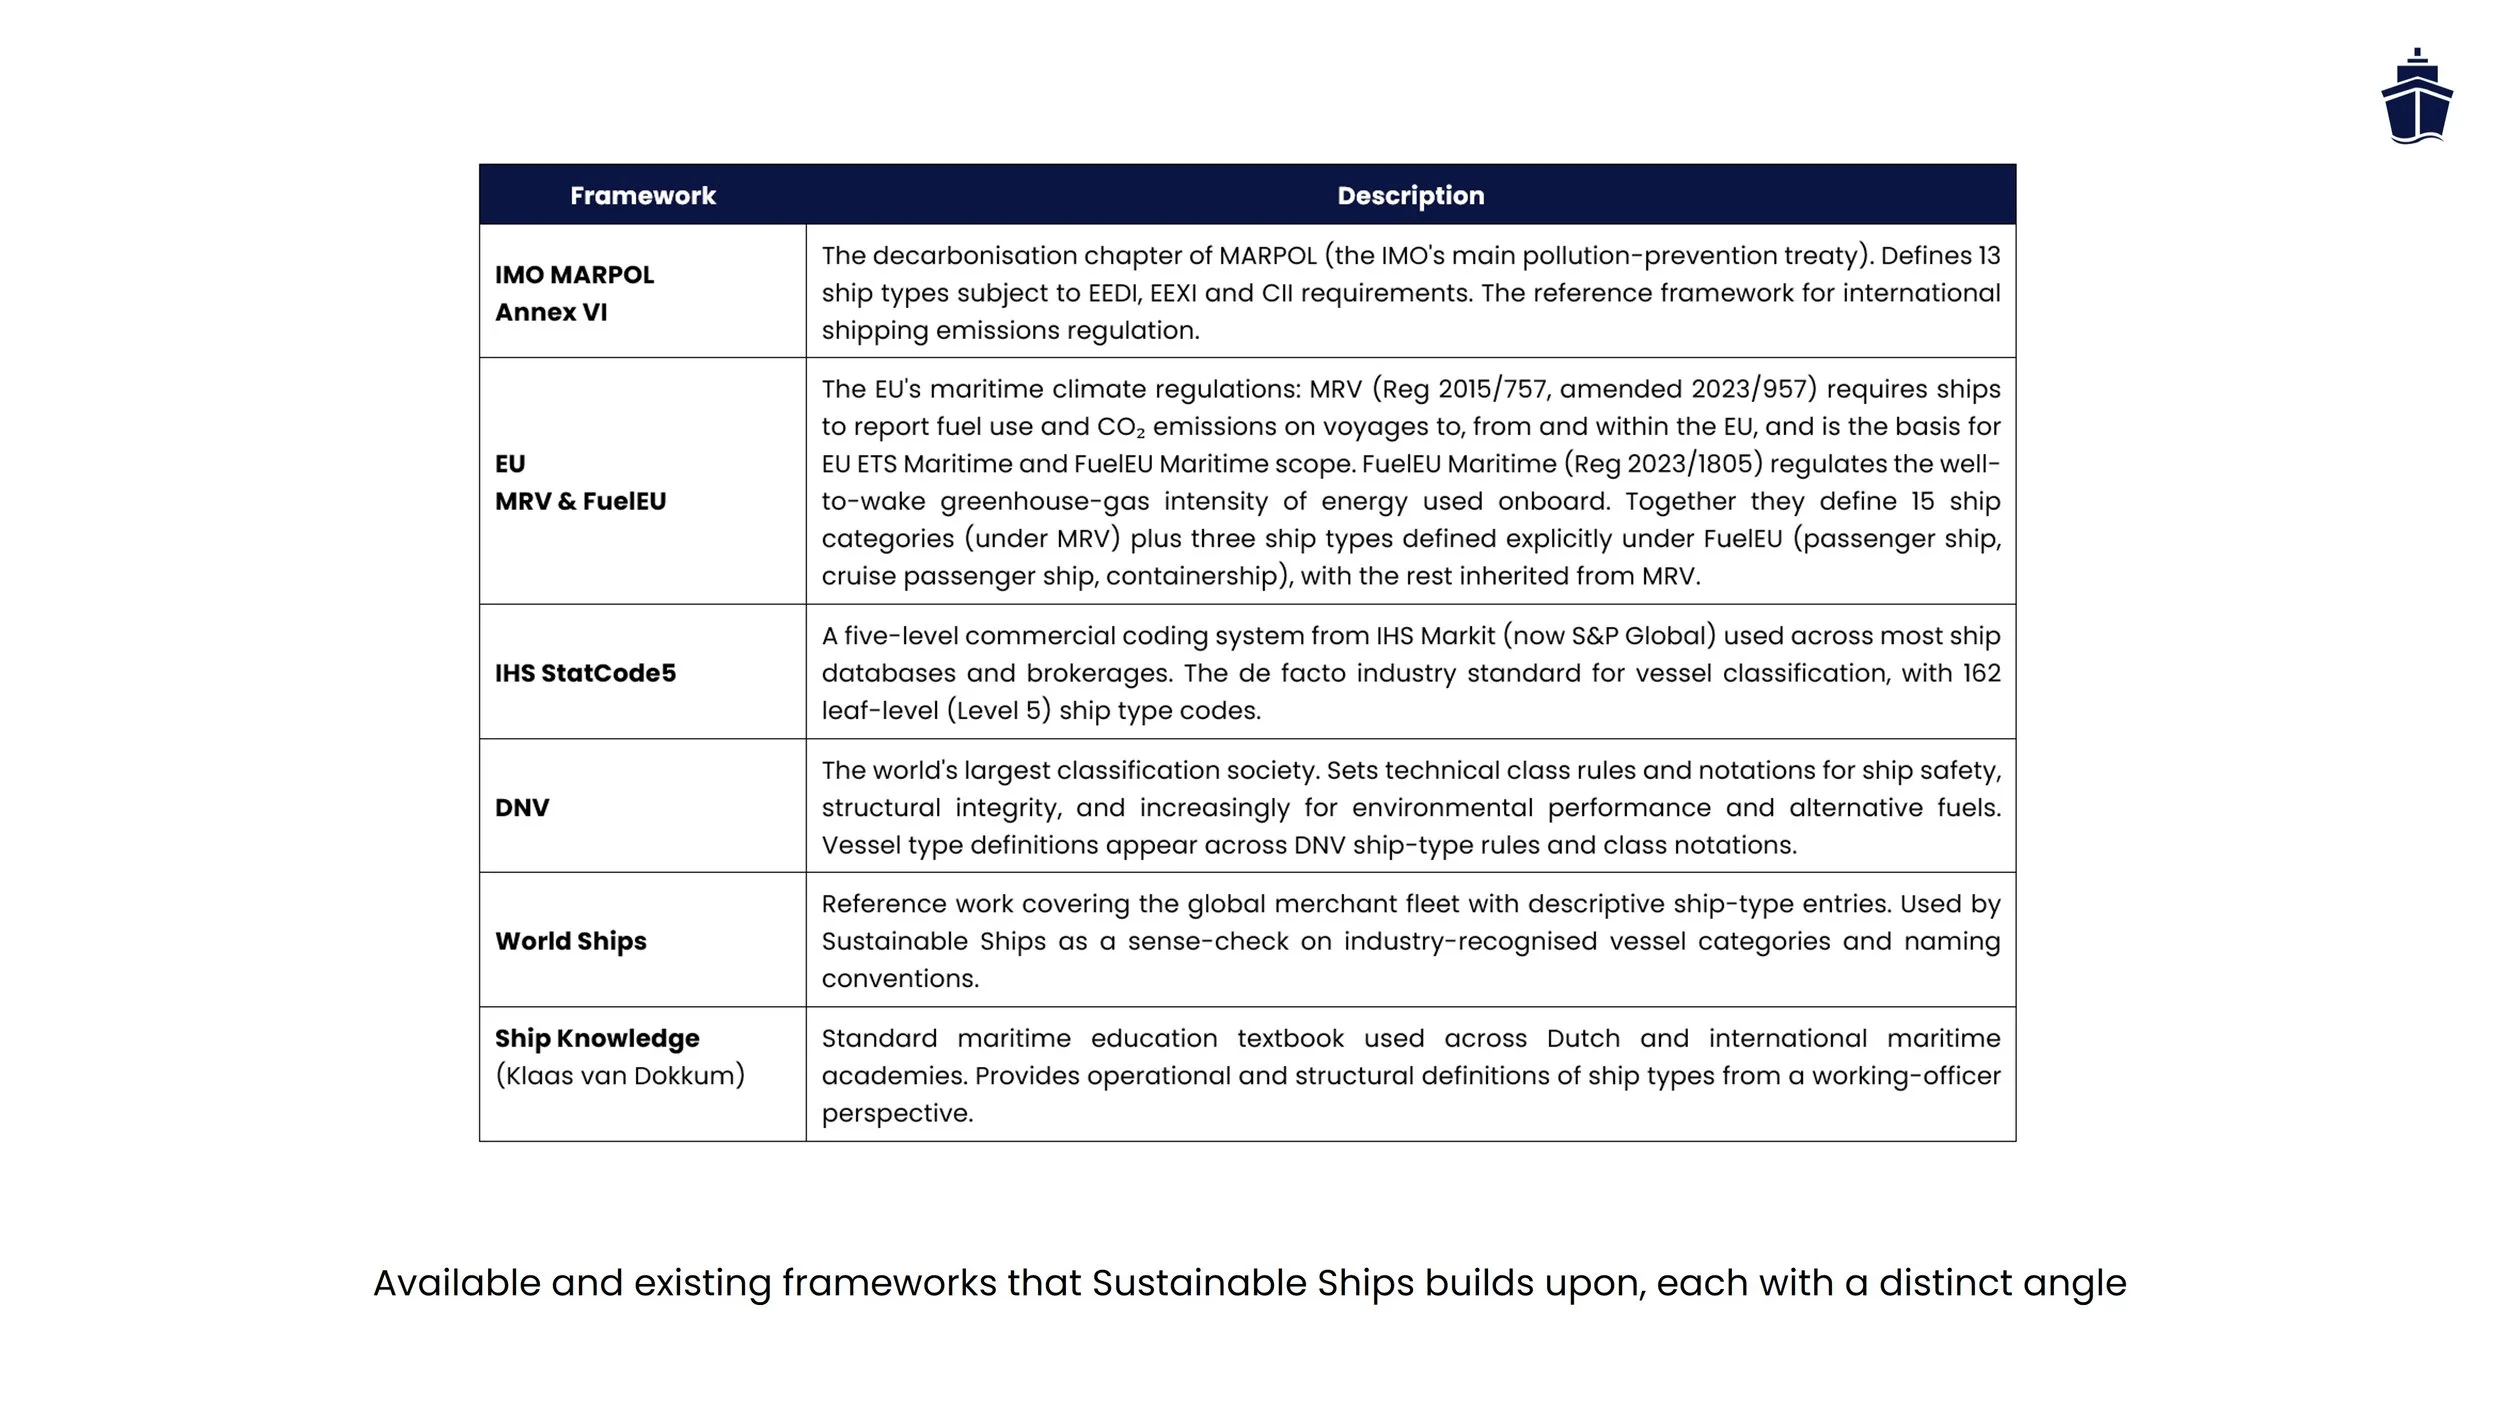
This masterclass sets out the methodology we developed to deal with that, built on these recognized frameworks A and calibrated against measured operational data. The approach is deliberately simple: power demand is a load factor multiplied by a scaling function of gross tonnage, applied for specific ship categories.
The methodology and the results are intended for project developers estimating revenue and sizing infrastructure across a fleet, a terminal or a whole port, particularly in the situation where you do not yet have ship-specific information and have not spoken to the chief engineer. It is explicitly not intended to predict a single named vessel. If you know which ship is coming and you can get the auxiliary engine data, you have better information than any model can give you.
Sign up to become a member and download the latest version of the guide, database and tools used in this masterclass.
(1) Why average power in kW this is the hardest number in shore power
Shore power itself is not complicated. Grid electricity is brought through a substation to an e-house containing transformers, a frequency converter for the European 50 Hz to shipboard 60 Hz step and the power management system, then through a cable management system to the ship's connection panel, onboard transformer and main switchboard, at which point the auxiliary engines can be shut down. Fuel consumption, emissions and noise stop. The infrastructure can be large and the engineering is real, but conceptually it is ‘sticking a plug into the ship’. Sticking it in is one thing, knowing the required size of the plug and the average power demand is hard, and there are four distinct reasons why.
The same ship varies enormously. Measured over a single port call, power demand fluctuates continuously with cargo operations, reefer load, hotel load, weather and crew behaviour. Reported variations reach 300%.
Sister ships are not identical in practice. Research on the Fortuny and Sorolla at Málaga found the two vessels differ by roughly 30% in power demand while doing the same thing at berth. Same design, same operation, different numbers.
Ships of the same size can differ tenfold. Plot installed auxiliary power against gross tonnage and the spread is striking. In the band around 30,000 GT, tankers differ by close to a factor of ten in installed auxiliary capacity, because one vessel is built for straightforward loading and discharge while another carries heating, cooling or pumping duties that change its energy profile entirely.
And the published sources disagree. IMO divides container ships by TEU. DNV uses gross tonnage. Bands differ, and there is no guarantee that what one framework calls a container ship matches another's definition. IMO itself notes there is no such thing as a single universal ship type definition. The result is that the same vessel can be assigned power demands differing by a factor of three or four depending on which source you open.
There is one more practical problem worth naming. If you ask a shipowner how much power they need, they will usually quote their maximum, because they want to be able to do everything they might ever do. That figure is typically about twice the actual average demand. Design to it and you overbuild the infrastructure and the business case with it.
Operational load tables help, and in the land of the blind the one-eyed man is king: if you have them, use them. But ships evolve. Engines are replaced, equipment is added, and a new crew can change energy use materially. The table tells you what the vessel should need, not what it does.
(2) Before you can average, you have to classify what a ship is
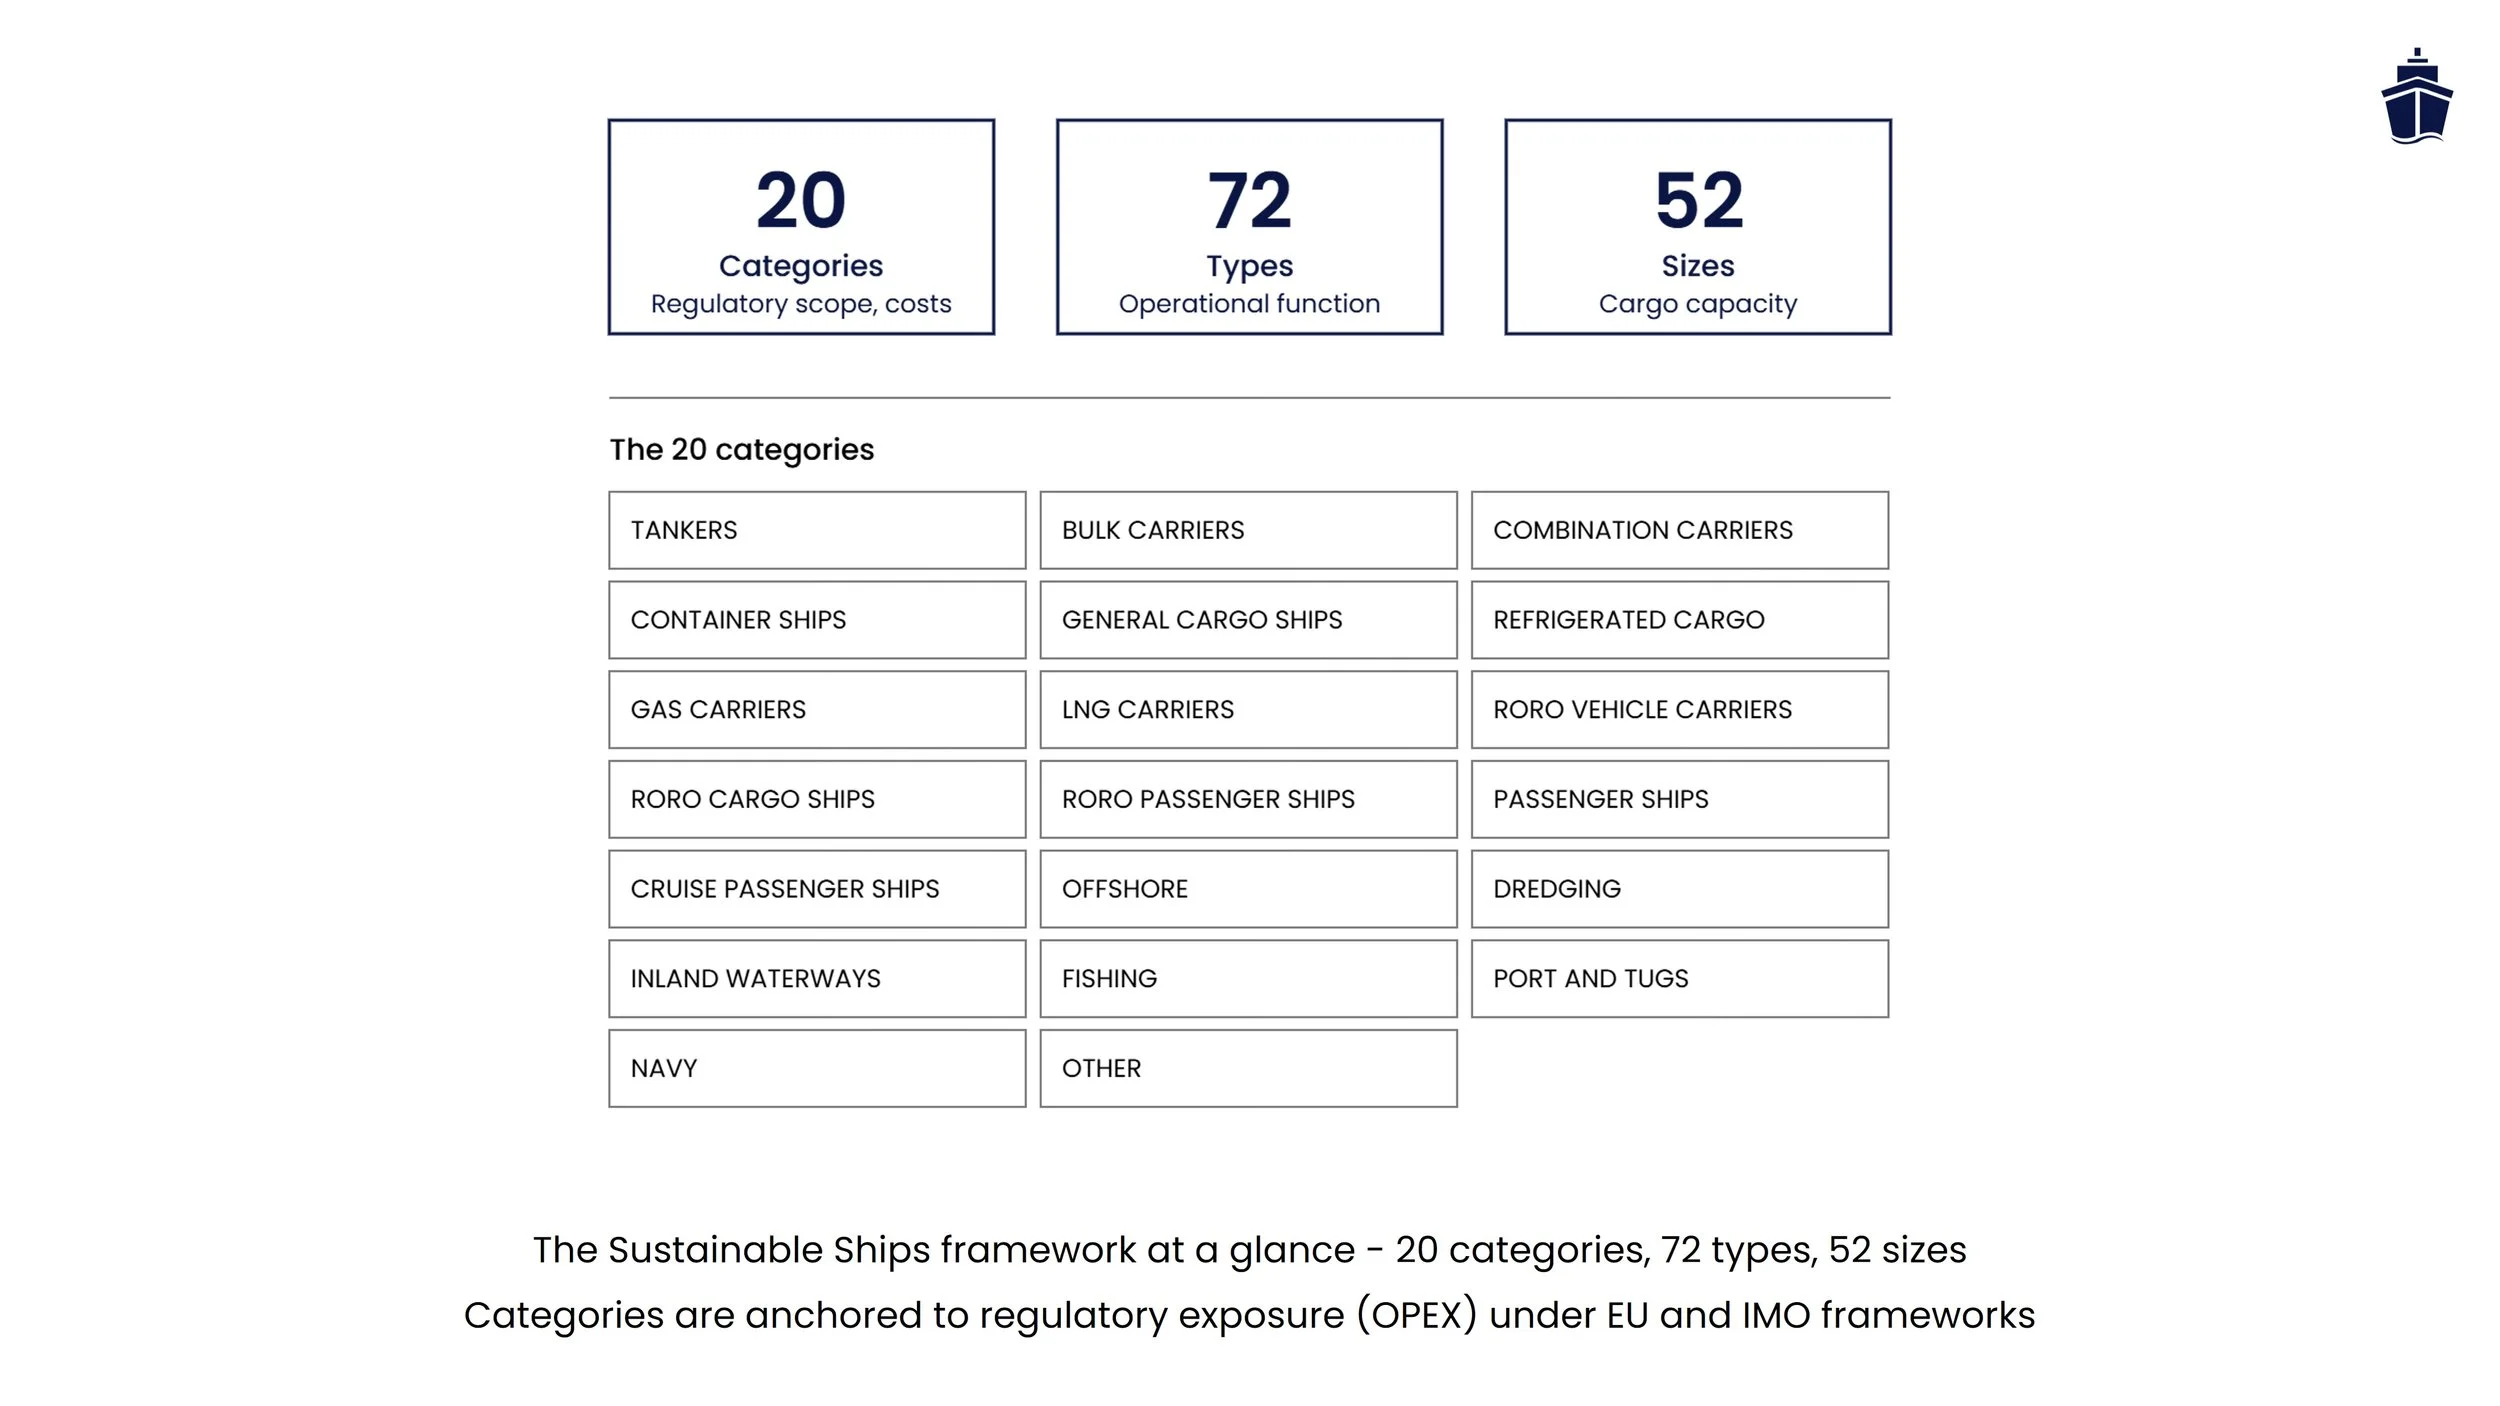
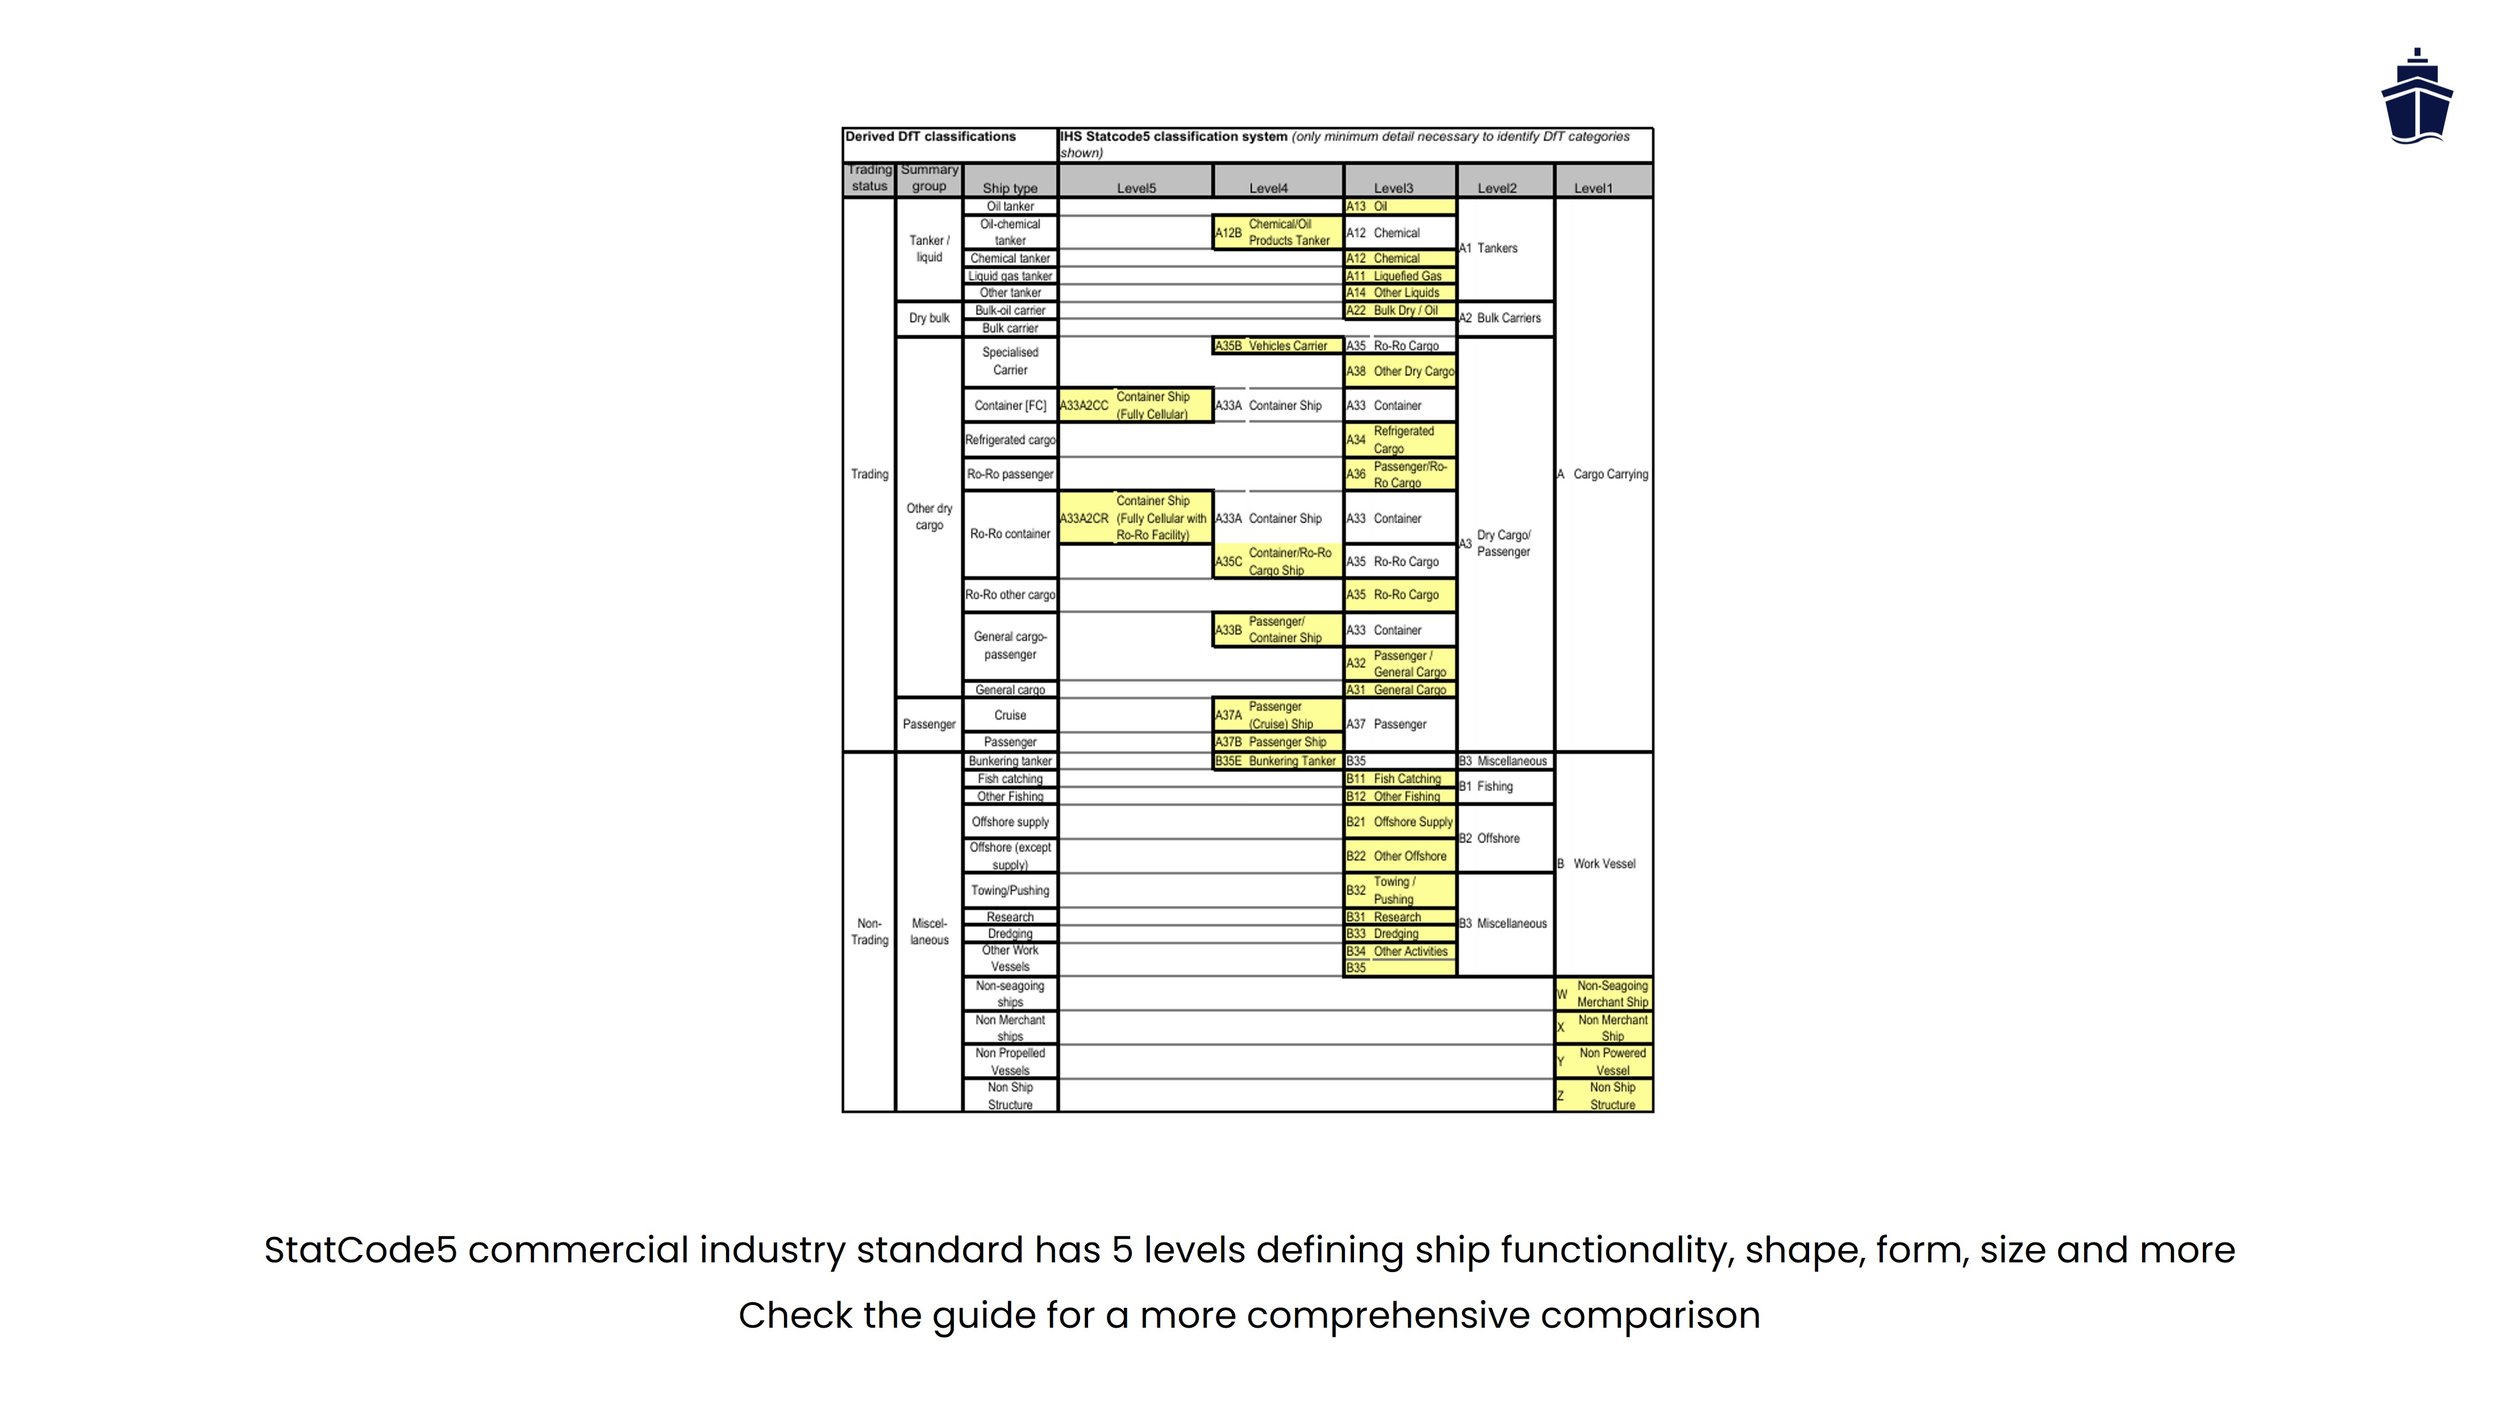
You cannot produce an average power demand per ship category until you have decided what a ship category is. Our classification, set out in the Ship Types Guide, works on three levels:
Category. The regulatory and economic grouping, aligned to how IMO and EU regulations such as EEXI, CII, FuelEU Maritime and EU ETS treat vessels. This matters because compliance costs flow from the category. It is the level at which we average power demand.
Type. Functional use and design. Power demand flows from the type: within the tanker category, a general liquid tanker behaves differently from an oil and chemical tanker or an oil products tanker.
Size. Larger ships generally need more power. Some categories, such as offshore, have types but no meaningful size classes.
A worked example: the Abao Explorer is tanker category, chemical tanker type, medium range size. Combine that with a terminal profile and you can immediately narrow the expected power range. If you know your terminal mostly handles oil and chemical tankers, the size distribution and therefore the power distribution tightens considerably.

(3) The methodology in one line
Power demand = load factor × scaling function (GT)
Every ship above 400 GT has a gross tonnage, which makes GT the only size parameter that allows cross-category and cross-source comparison. The two components:
Scaling functions. Plot installed auxiliary engine power against GT for every ship in the database and fit a curve. For almost all categories that fit is a power law; container ships are better described by a polynomial. We maintain two variants: total installed auxiliary power, and single largest installed auxiliary engine. The second is useful for a different question, namely whether a terminal needs high voltage or low voltage. Most ships have total installed auxiliary capacity below roughly 5 MW, and the data shows clear clustering around standard ship sizes rather than a smooth continuum.
Load factors. A ship does not use its installed capacity at berth. Measured and validated operational data shows that average demand is typically only 20% to 30% of installed auxiliary power. Auxiliary engines are over-dimensioned by design: redundancy means you fit two so the ship still has power when one is serviced, and safety margins are added on top. We derive low, average and high load factors from the measured data, excluding the lowest and highest few percent as outliers. Applied per ship category, that gives a low, average and high power demand estimate at any gross tonnage.
The whole framework rests on 7,102 ships with auxiliary engine data and 153 measured or validated operational datasets. There is no full statistical treatment behind the percentiles, and deliberately so: the spread in the underlying data is wide enough that a more rigorous statistical apparatus would add precision without adding accuracy.
(4) Not all data is equal: four tiers are defined
Tier 1, installed auxiliary engine data. The physical ceiling. A ship cannot draw more than it has installed. This is the structural backbone of the scaling functions.
Tier 2, measured time series. Real operational demand over time. Worth its weight in gold, and the basis for the load factors.
Tier 3, shipowner surveys. What owners believe they need. Systematically overstated, often by around a factor of two.
Tier 4, regulatory bins. IMO, DNV and EMSA published bands. Useful for benchmarking, but with differing size parameters and opaque derivations.
Only Tiers 1 and 2 are used to build the model. Tiers 3 and 4 are laid over the results as a sanity check. A cautionary note on even the best data. On one project with six months of measured operational data, two different chief engineers on the same vessel looked at the same dataset and reached different conclusions: one wanted a certain capacity, the other wanted twice that. Perfect data still produces disagreement, which is exactly why a documented, repeatable methodology matters more than any single number.
(5) What the results look like per ship category
Presented as box plots per category, the picture divides into two groups.
Predictable categories. General cargo ships average around 160 kW with a tight spread, so a general cargo terminal can be sized with high confidence. Tankers average roughly 1 MW across the range up to around 50,000 GT, rarely dropping below 200 to 300 kW, with half of all observations inside a reasonably narrow band. Bulk carriers behave similarly: only a small fraction of installed capacity is actually used at berth.
Unpredictable categories. RoRo vehicle carriers, RoRo cargo ships, passenger ships and especially cruise ships show extreme ranges, exceeding 2,000 kW even within the middle 50% of observations, with long tails above that. Cruise ships are not shown at all in the category overview because only around 40 usable data points exist. For these segments the honest answer is that a category average is not good enough, and the analysis has to go down to the individual vessel.
That split is the practical takeaway. For tanker, bulk and general cargo terminals, a category-level estimate is defensible. For RoRo, passenger and cruise, treat the category average as a starting point for a conversation, not an input to a transformer specification.
One illustrative data point on the container side: the MSC Maya, at roughly 200,000 GT, has a single largest installed auxiliary engine of 5,500 kW. Even at 20% to 30% utilisation that is a substantial berth load, which is consistent with the 8 MW threshold the standards use as the point where high voltage becomes the practical requirement.
(6) Which formulas and load factor should you use, and what about the maximum power?
For revenue and business cases, use the average. There is exactly one true average for any vessel and it can only be calculated in retrospect, once you know what the ship actually did. Until then, the average load factor is the closest defensible estimate, and it is the one that produces a business case nearest to reality.
Use the low band for conservative revenue cases. If you are stress-testing a project, or you need a revenue floor for a financing discussion, the low band is the right input. Measured time-series data tends to sit closer to the low band than to the shipowner-reported figures.
Use the high band for engineering and dimensioning, not for revenue. Sizing on the high band and then modelling revenue on it too is how projects end up looking profitable on paper and disappointing in operation. For maximum demand, the physical limit is the installed auxiliary capacity. If you know the vessel, use its rated auxiliary power as the ceiling and the average for revenue. If you do not, use the high band or the scaling function at full value. In practice most ships run only one or two auxiliary engines at the quayside; container ships and tankers are the exceptions, because they do more work at berth.
(7) Main conclusions
Berth power demand is uncertain at every level. The same ship varies up to 300% during a call, sister ships differ by around 30%, and ships of the same size can differ tenfold in installed capacity.
Shipowner-quoted figures are typically about double the real average, because owners quote their maximum. Designing to that number overbuilds the project.
Average demand is only 20% to 30% of installed auxiliary capacity, because auxiliary engines are over-dimensioned for redundancy and safety by design.
Gross tonnage is the only universal size parameter, which is what makes cross-category and cross-source comparison possible at all.
The methodology is a load factor multiplied by a GT-based scaling function, applied per ship category: power law for most categories, polynomial for container ships.
Only installed engine data and measured time series should drive the model. Surveys and regulatory bins are for validation, not calibration.
Some categories are predictable and some are not. General cargo around 160 kW with a tight spread and tankers around 1 MW are defensible at category level. RoRo, passenger and cruise are not, and need vessel-level analysis.
Use average for revenue, low for conservative cases, high for engineering. Never size on high and model revenue on high.
The method is built for fleets, not single ships. Across a spread of vessels the law of large numbers works in your favour; for one named vessel, ask the chief engineer.
Sign up for premium tools and benefits

The Shore Power Quickscan is a comprehensive tool designed to provide a business case for a shore power refit onboard vessels, based on IEC/IEEE 80005. It includes CAPEX estimates, operational expenses including fuel costs and engine maintenance, emissions savings as well as key regulations such as FuelEU and EU ETS. This purchase allows you to store your calculations, work offline anywhere, plus print a comprehensive techno-economic feasibility that you can show off to friends or your management.
Use Apple Pay to purchase the Excel (only on iPhone) - contact helpdesk for payment by invoice
Don’t want to sign up? Check pay-per-use options
References
Sustainable Ships - Average Shore Power Demand Database
Sustainable Ships - Average Shore Power Demand Guide
Sustainable Ships - What does it cost to generate electricity onboard a ship?
Sustainable Ships - Shore Power Quickscan
Sustainable Ships - Overview of Shore Power Sockets and Plugs, IEC/IEEE 80005
Sustainable Ships - FuelEU Maritime
Sustainable Ships - AFIR
ABB and Chalmers University - Shore-Side Power Supply, MSc thesis
TNO - measured berth power demand of container vessels
IMO, DNV and EMSA - published shore power demand bands
IEC/IEEE 80005-1 and 80005-3 - shore connection systems
You might also like


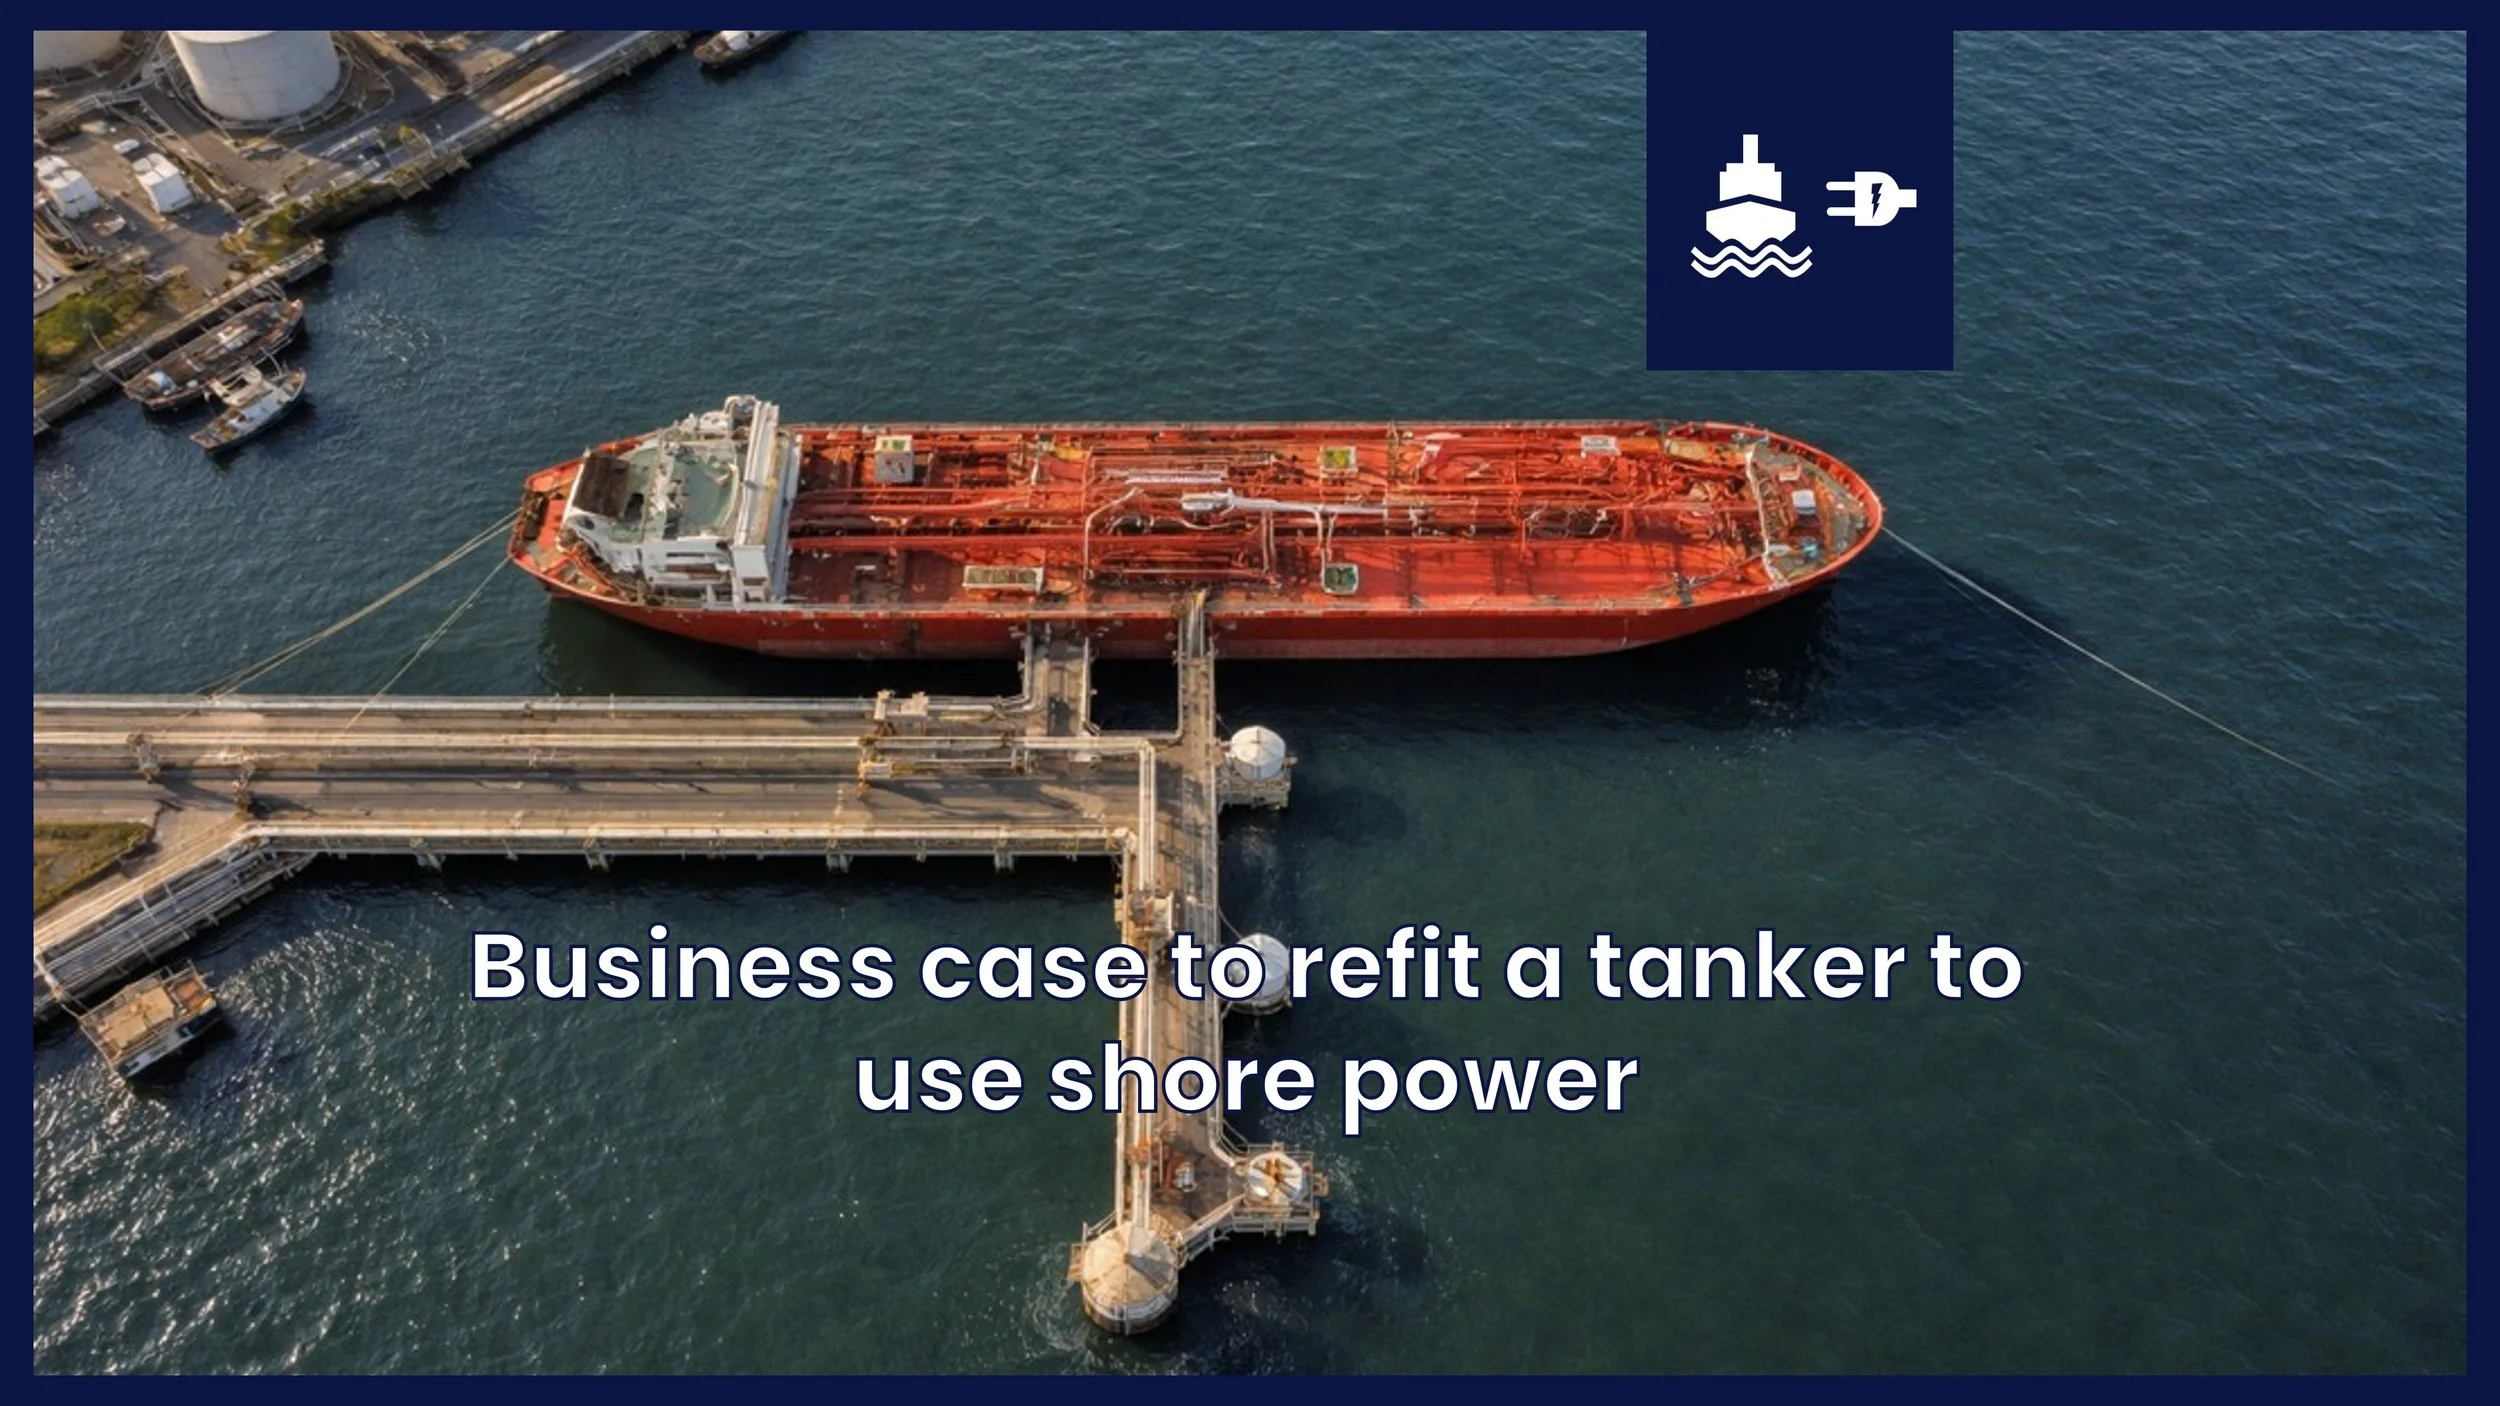



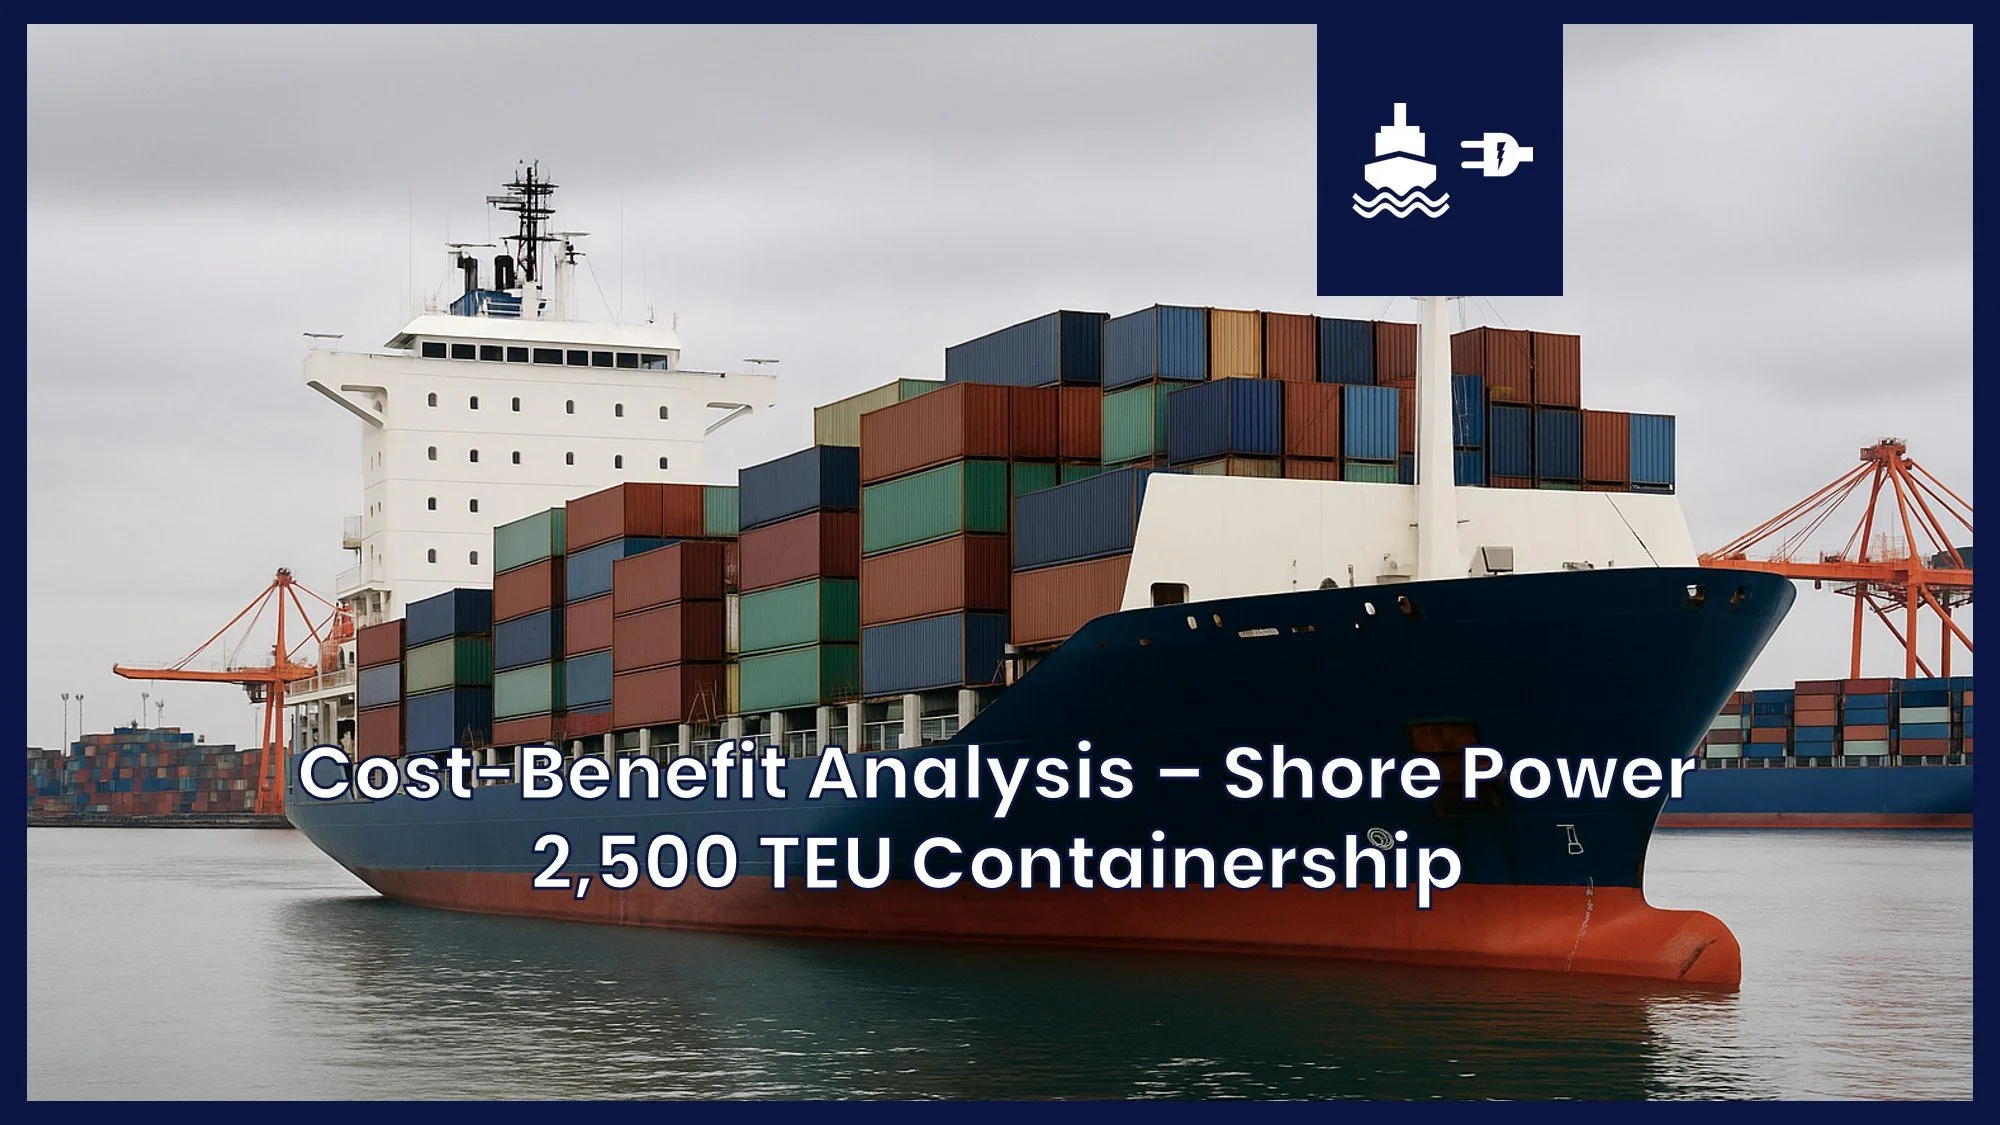


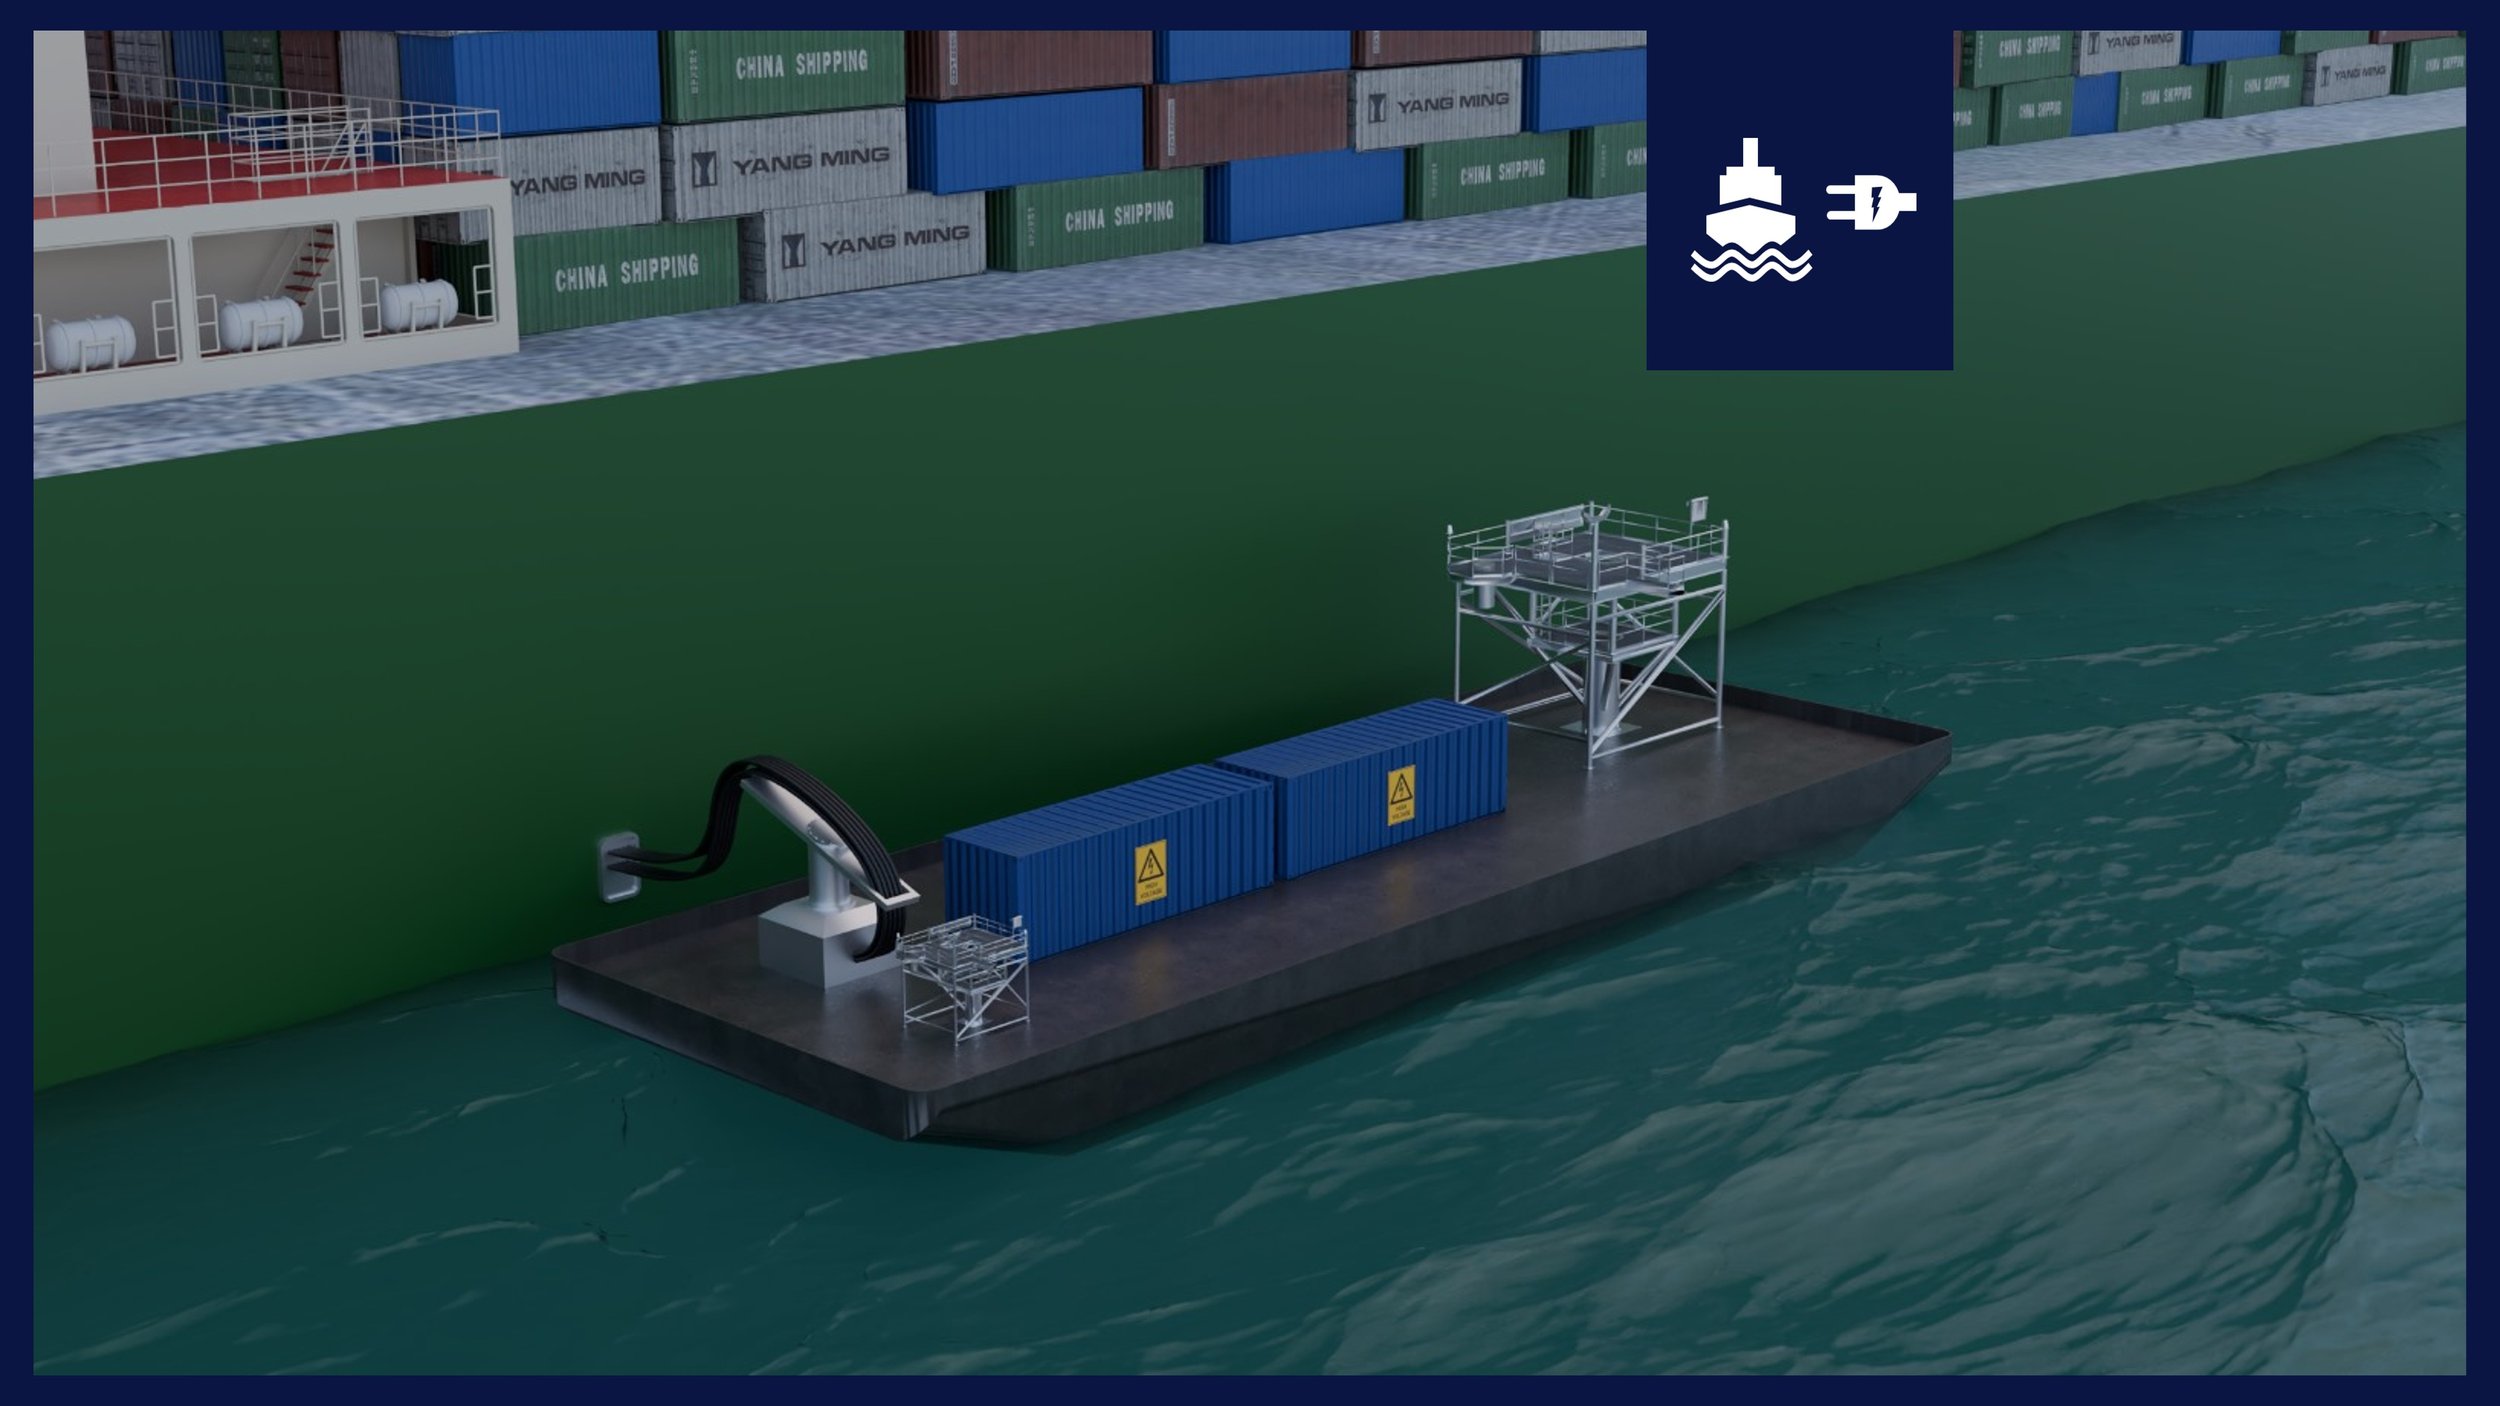



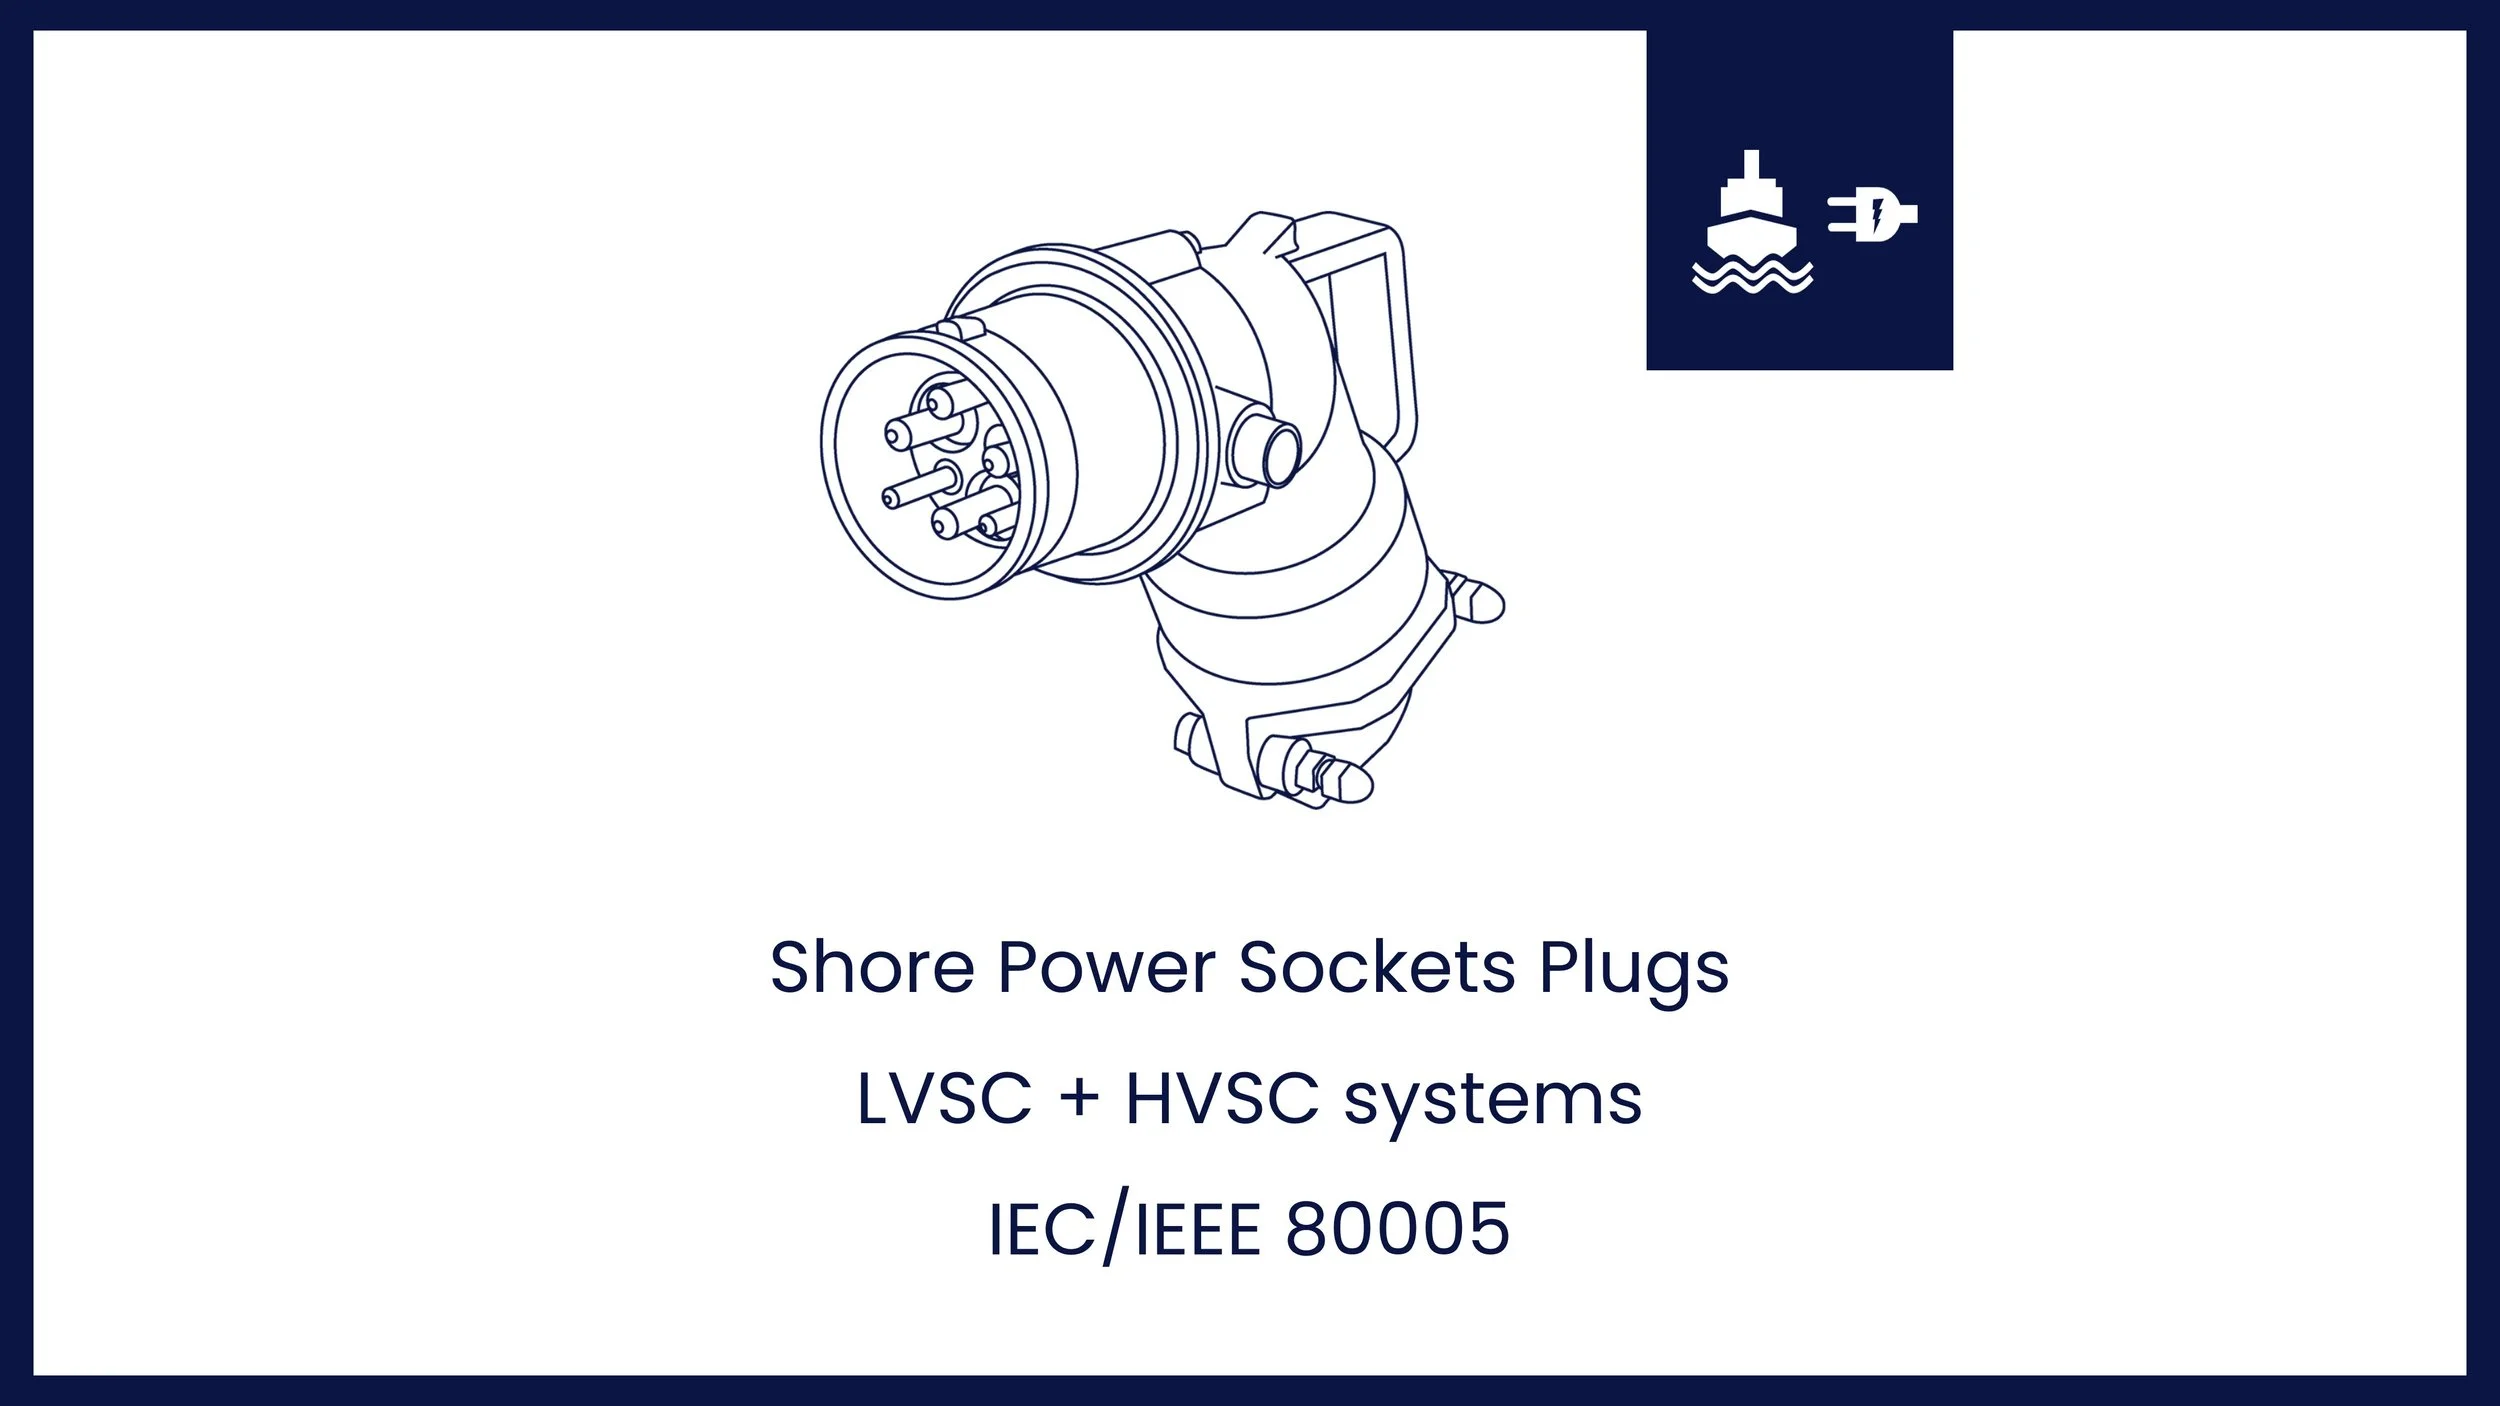










How much power does a ship actually draw at berth? The same vessel can vary by 300%, sister ships doing exactly the same can differ by 30%, and Tankers of the same size can differ tenfold in installed capacity. This masterclass explains the methodology we use to estimate average shore power demand per ship category, using GT-based scaling functions and calibrated load factors built on 7,102 ships and 153 measured datasets.