
Optimising FuelEU compliance strategy for minimum cost - penalty, pooling, or biofuels?
Comparing three strategies (penalty, pooling, biofuels) to ensure compliance at minimal cost for a 4-ship fleet from 2026 to 2040
This case study compares three strategies to comply with FuelEU Maritime: accept the penalty, ‘buy credits’ through pooling with a third party, or blend biofuels into the bunker mix. Using the FuelEU Pool Tool on a representative 4-ship fleet (mostly HFO, some MGO, 100% EU jurisdiction) we project compliance costs from 2026 through 2040 and stress-test the result against fuel-price to determine the lowest cost strategy.
Results show that with today's fuel pricing and assumptions, pooling and biofuels land within a few percent of each other as best options. Buying credits through pooling and blending biofuels both beat business as usual, by 8% and 5% respectively, with pooling the better of the two by ~3%. The interesting answer is not “what is the winning strategy”. It is the tipping point between pooling and biofuel costs. Small moves in the biofuel price flip which strategy wins, and the tightening FuelEU target after 2030 structurally favours biofuels over time. Luckily this threshold can be calculated with the push of a button in the FuelEU Pool Tool.
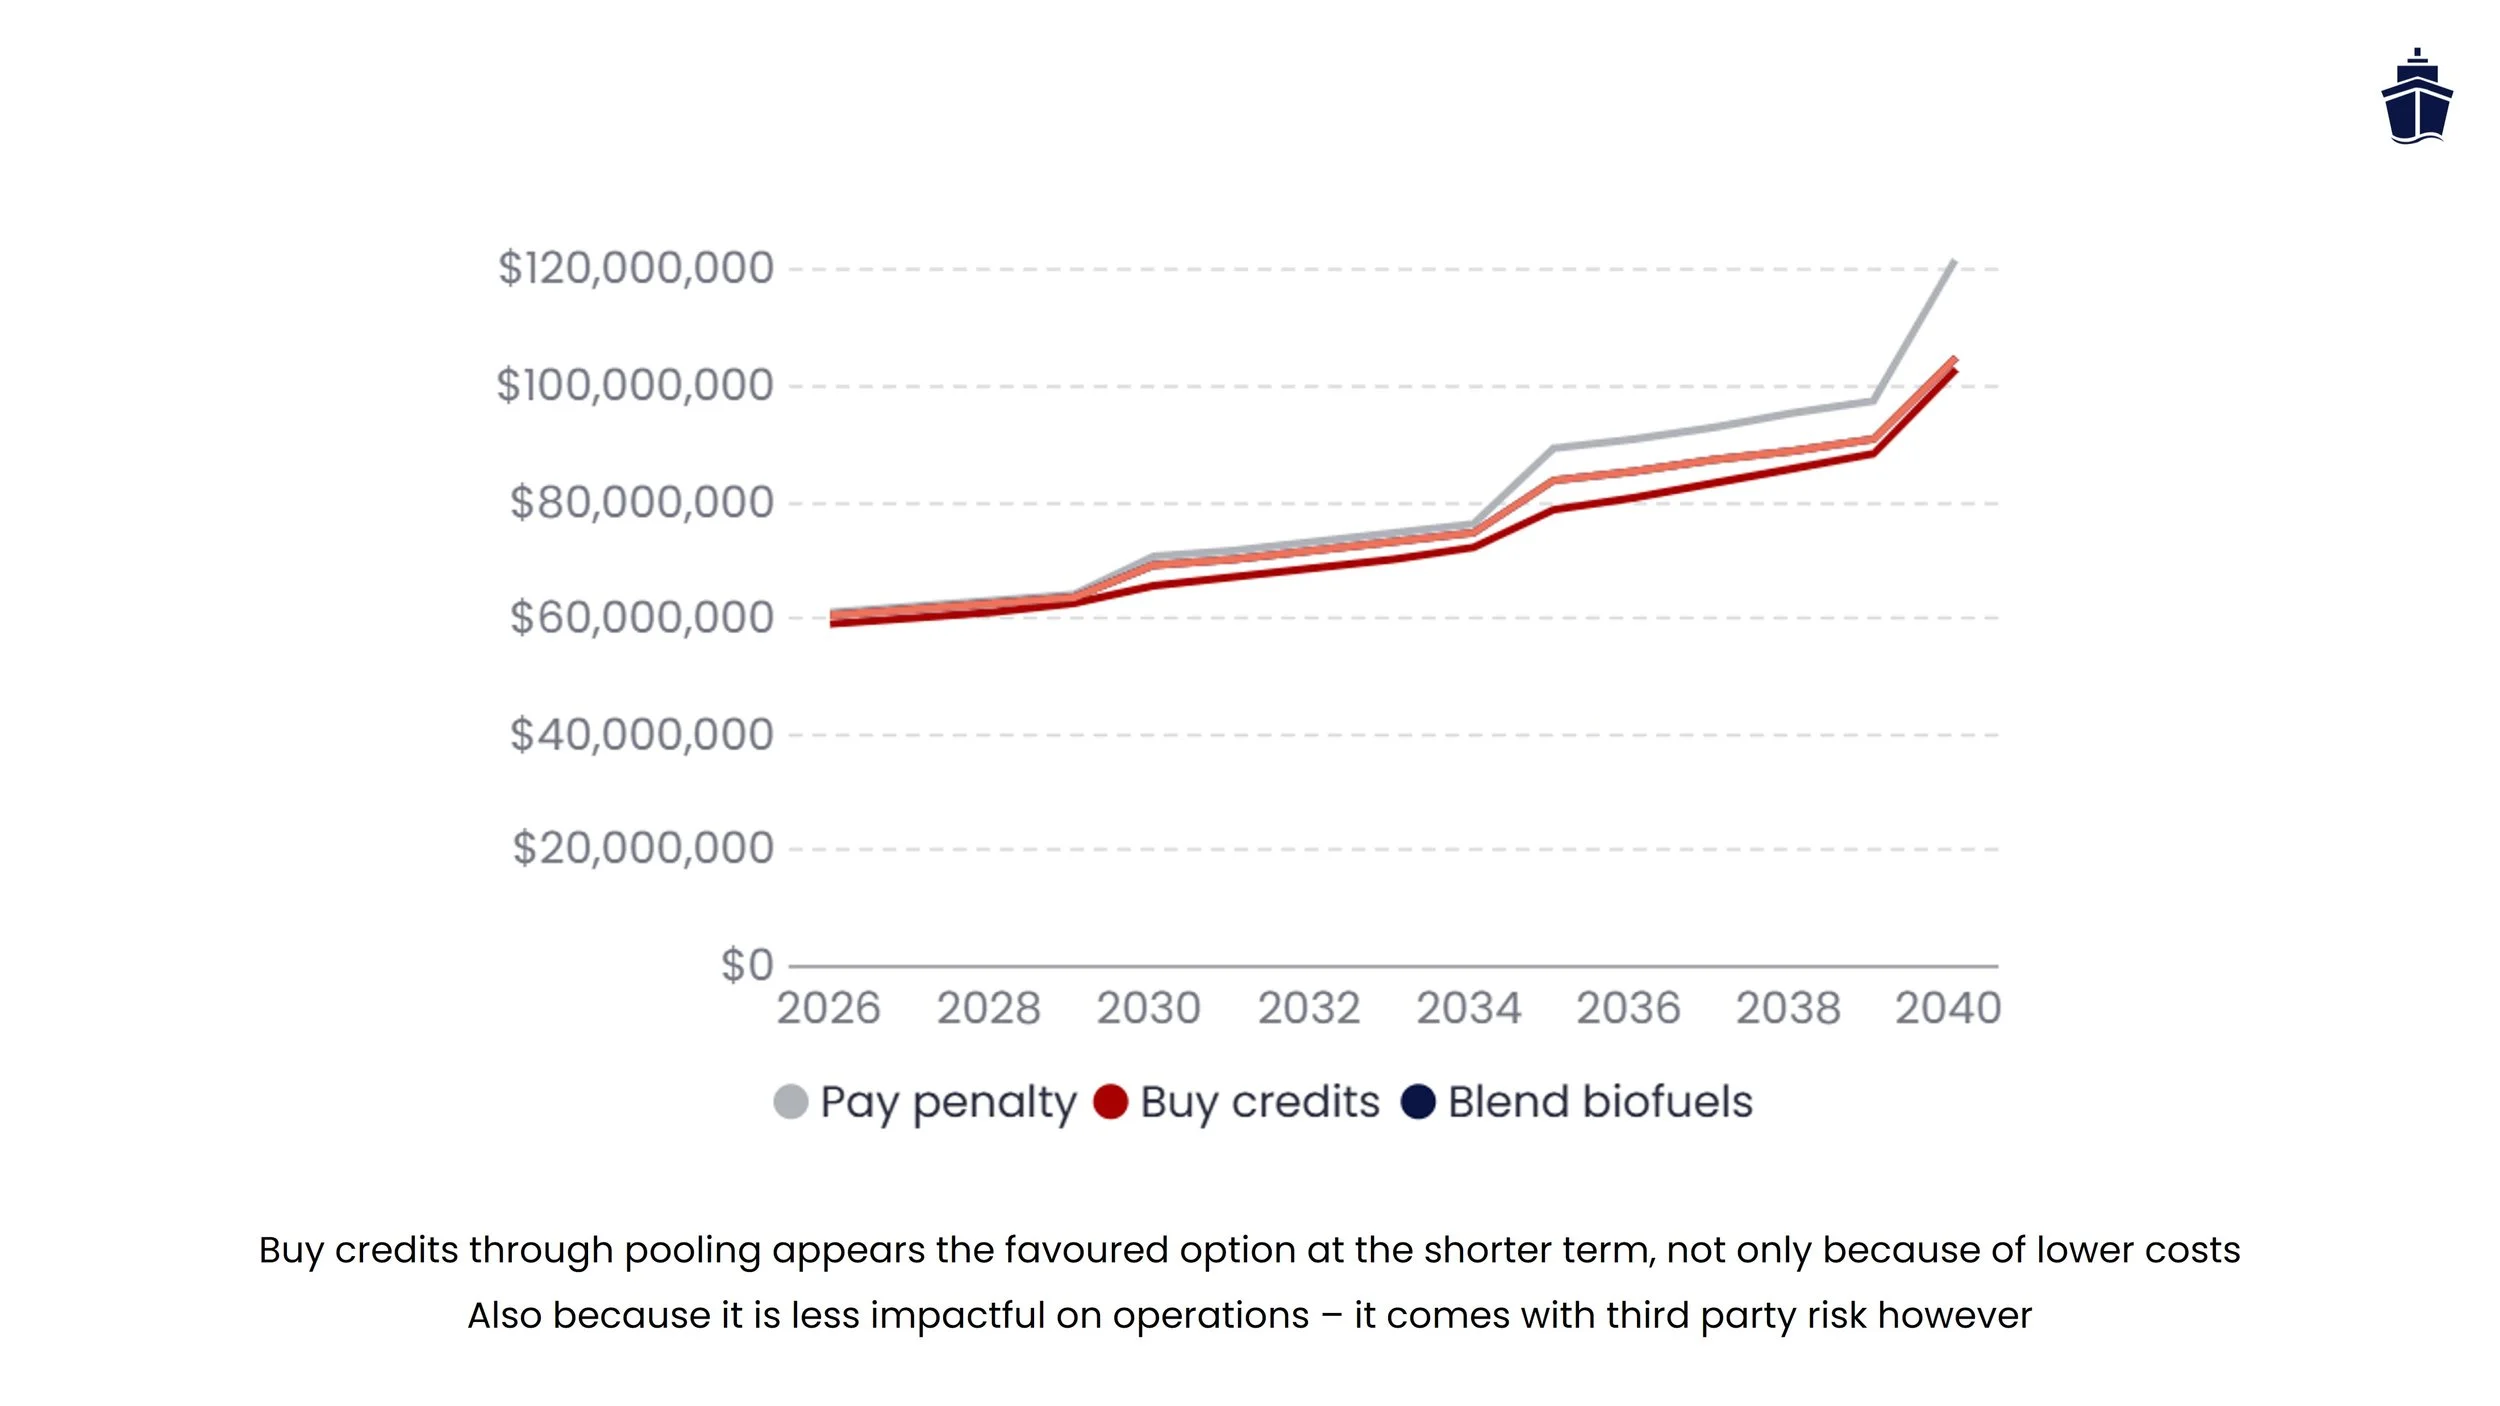
The honest framing becomes thus: pooling buys you time, biofuels buy you compliance. Unless you have (long-term) contracts for specific biofuels at a good price, pooling seems the best strategy until 2030 but it has specific drawbacks and risks that are explained below.
For this analysis, the FuelEU Pool Tool is used to directly calculate all three different strategies on demand. This tool is intended for shipowners who want to understand FuelEU exposure in the coming years and compare up to three different alternative strategies. Use or download the FuelEU Pool Tool to perform a sensitivity analysis and determine your preferred strategy - scroll down below and have fun!


The problem
FuelEU is extremely complicated - how to meet compliance at the lowest possible cost?
Since 1 January 2025, every ship above 5,000 GT trading in the EU has had a GHG-intensity target to meet, a cap on the well-to-wake emissions per MJ of energy used on board. The cap tightens in steps: –2% in 2025, –6% in 2030, –14.5% in 2035, –31% in 2040, and so on. Fail to meet it and you pay a penalty, indexed at €2,400 per tonne of VLSFO-equivalent energy deficit for now, with a multiplier added if you're non-compliant two years running. This, in a nutshell, is FuelEU Maritime. The regulation is complex, tricky and hard to interpret, thereby creating a “recalculation problem” for every shipowner. The questions we hear every week are some variation of:
"How much will FuelEU actually cost my fleet over the next 5 to 10 years?"
"Is it cheaper to pay the penalty, buy pool credits from a third party, or start blending biofuels?"
"At what biofuel price does blending stop making sense vs. just buying credits?"
The economics depend on your fleet's fuel type and consumption, fuel prices, the amount of time you spent in the EU, the biofuel price you can actually source plus on which ships you can apply it, and finally the costs for “FuelEU credits” you can negotiate when pooling with other shipowners. To solve this question with a click of a button, we have updated the FuelEU Pool Tool to compare these scenarios in an instant.
The fleet
Ships, voyage, fuel consumption and operational profile
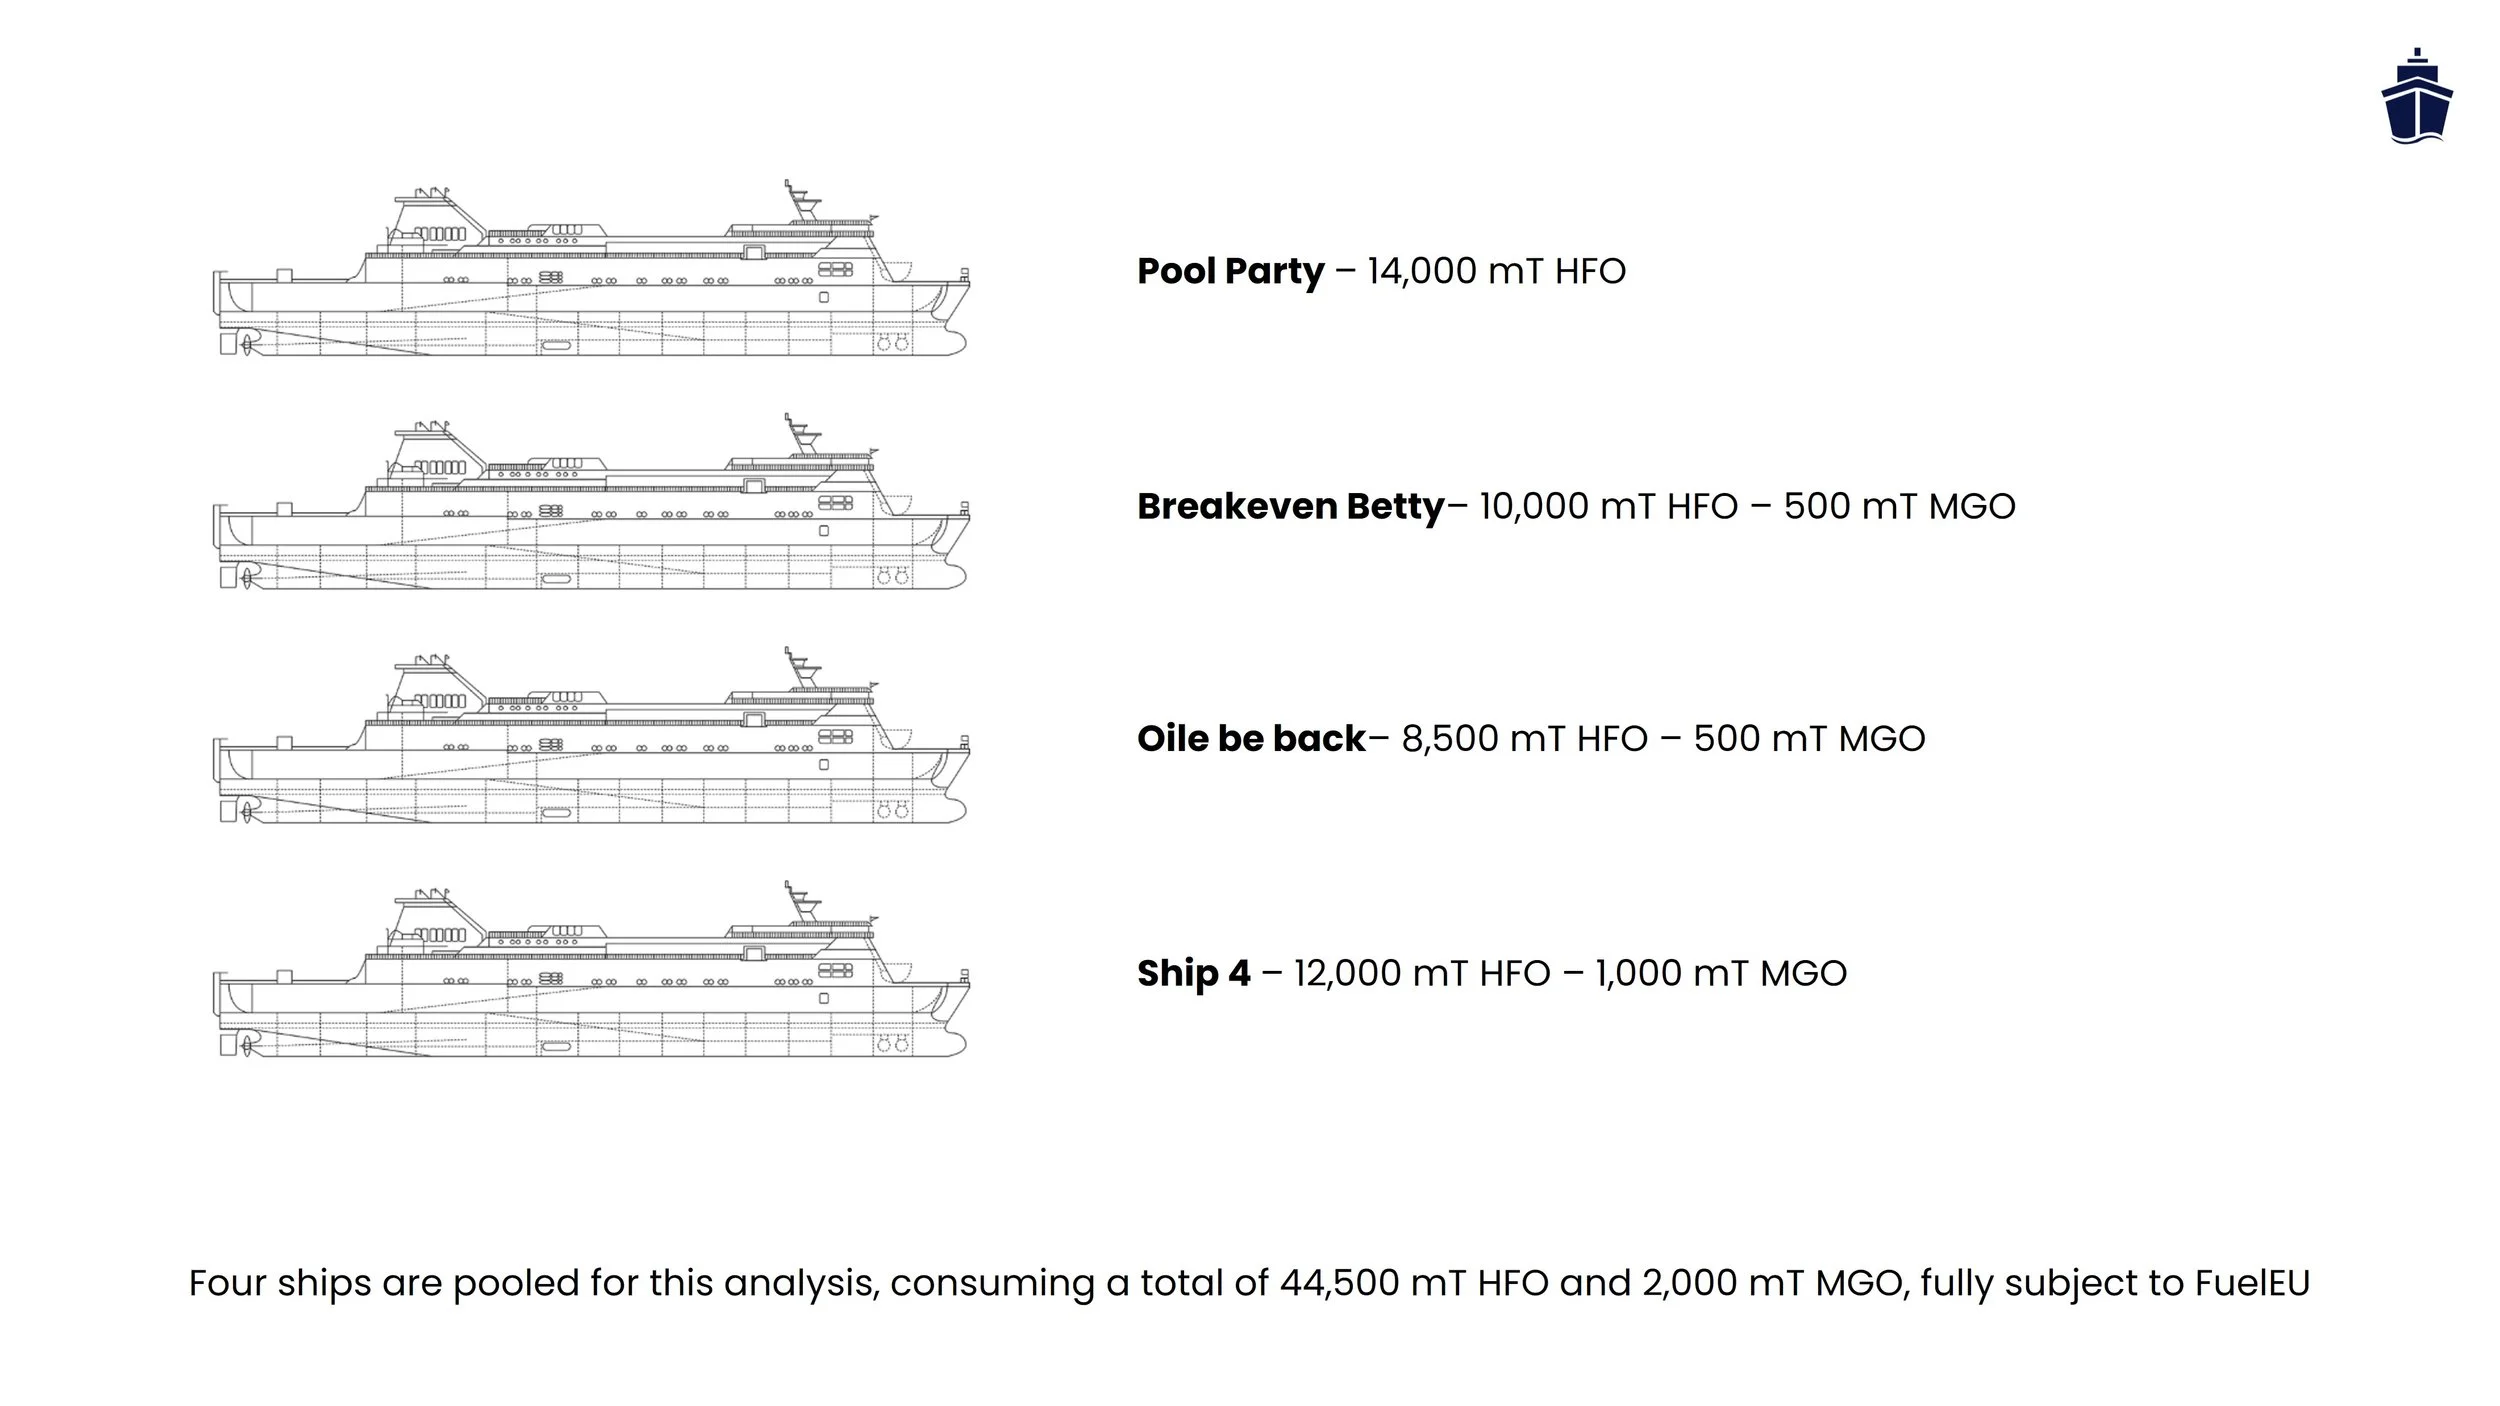
For this case study a representative 4-ship fleet is chosen to reflect a realistic short-sea / RoRo / ferry operator. The fleet is HFO-dominant, with a small MGO tail, but all fossil without any current use of biofuels. The ships operate fully in the EU and are 100% subject to FuelEU Maritime for all voyages. The four ships are pooled together in a representative fleet for FuelEU purposes and operational parameters are kept constant in the analysis period.
The strategies
Three strategies are compared, ranging from least impactful on operations to most impactful on operations. They are not mutually exclusive in real life, most fleets will end up with a blend of biofuels and pooling, or changing after a certain date, but modelling them pure-form makes the trade-offs visible.
Penalty (business as usual)
Keep bunkering as today and pay the FuelEU penalty every year. No operational change, no supplier switching. The simplest strategy on paper, and the most financially exposed once the target tightens in 2030 and 2035. Useful as a baseline: it's the "do nothing" counterfactual every other strategy is measured against. It is never recommended.
Pooling (buying credits from third party)
The deficit is covered by buying surplus compliance from a third party, priced at $200 per tonne CO₂-eq in the base case. Economically this converts a regulatory penalty (€2,400 / mTeq) into a market-based operating cost (~$200 / mTeq) which depends on the pool and fuel used in that pool. No operational change on board. Attractive in the short term because commitment is low, but exposed to credit-market price risk and counterparty risk. In other words; it is expected that costs will rise over time as surplus (supply of credits) is reduced, and you are dependent on other shipowners surplus which could change over the course of the year when contracts or voyages change. Good options when you have good contacts and contracts.
Biofuels (blending with biofuels to achieve perfect GHG target)
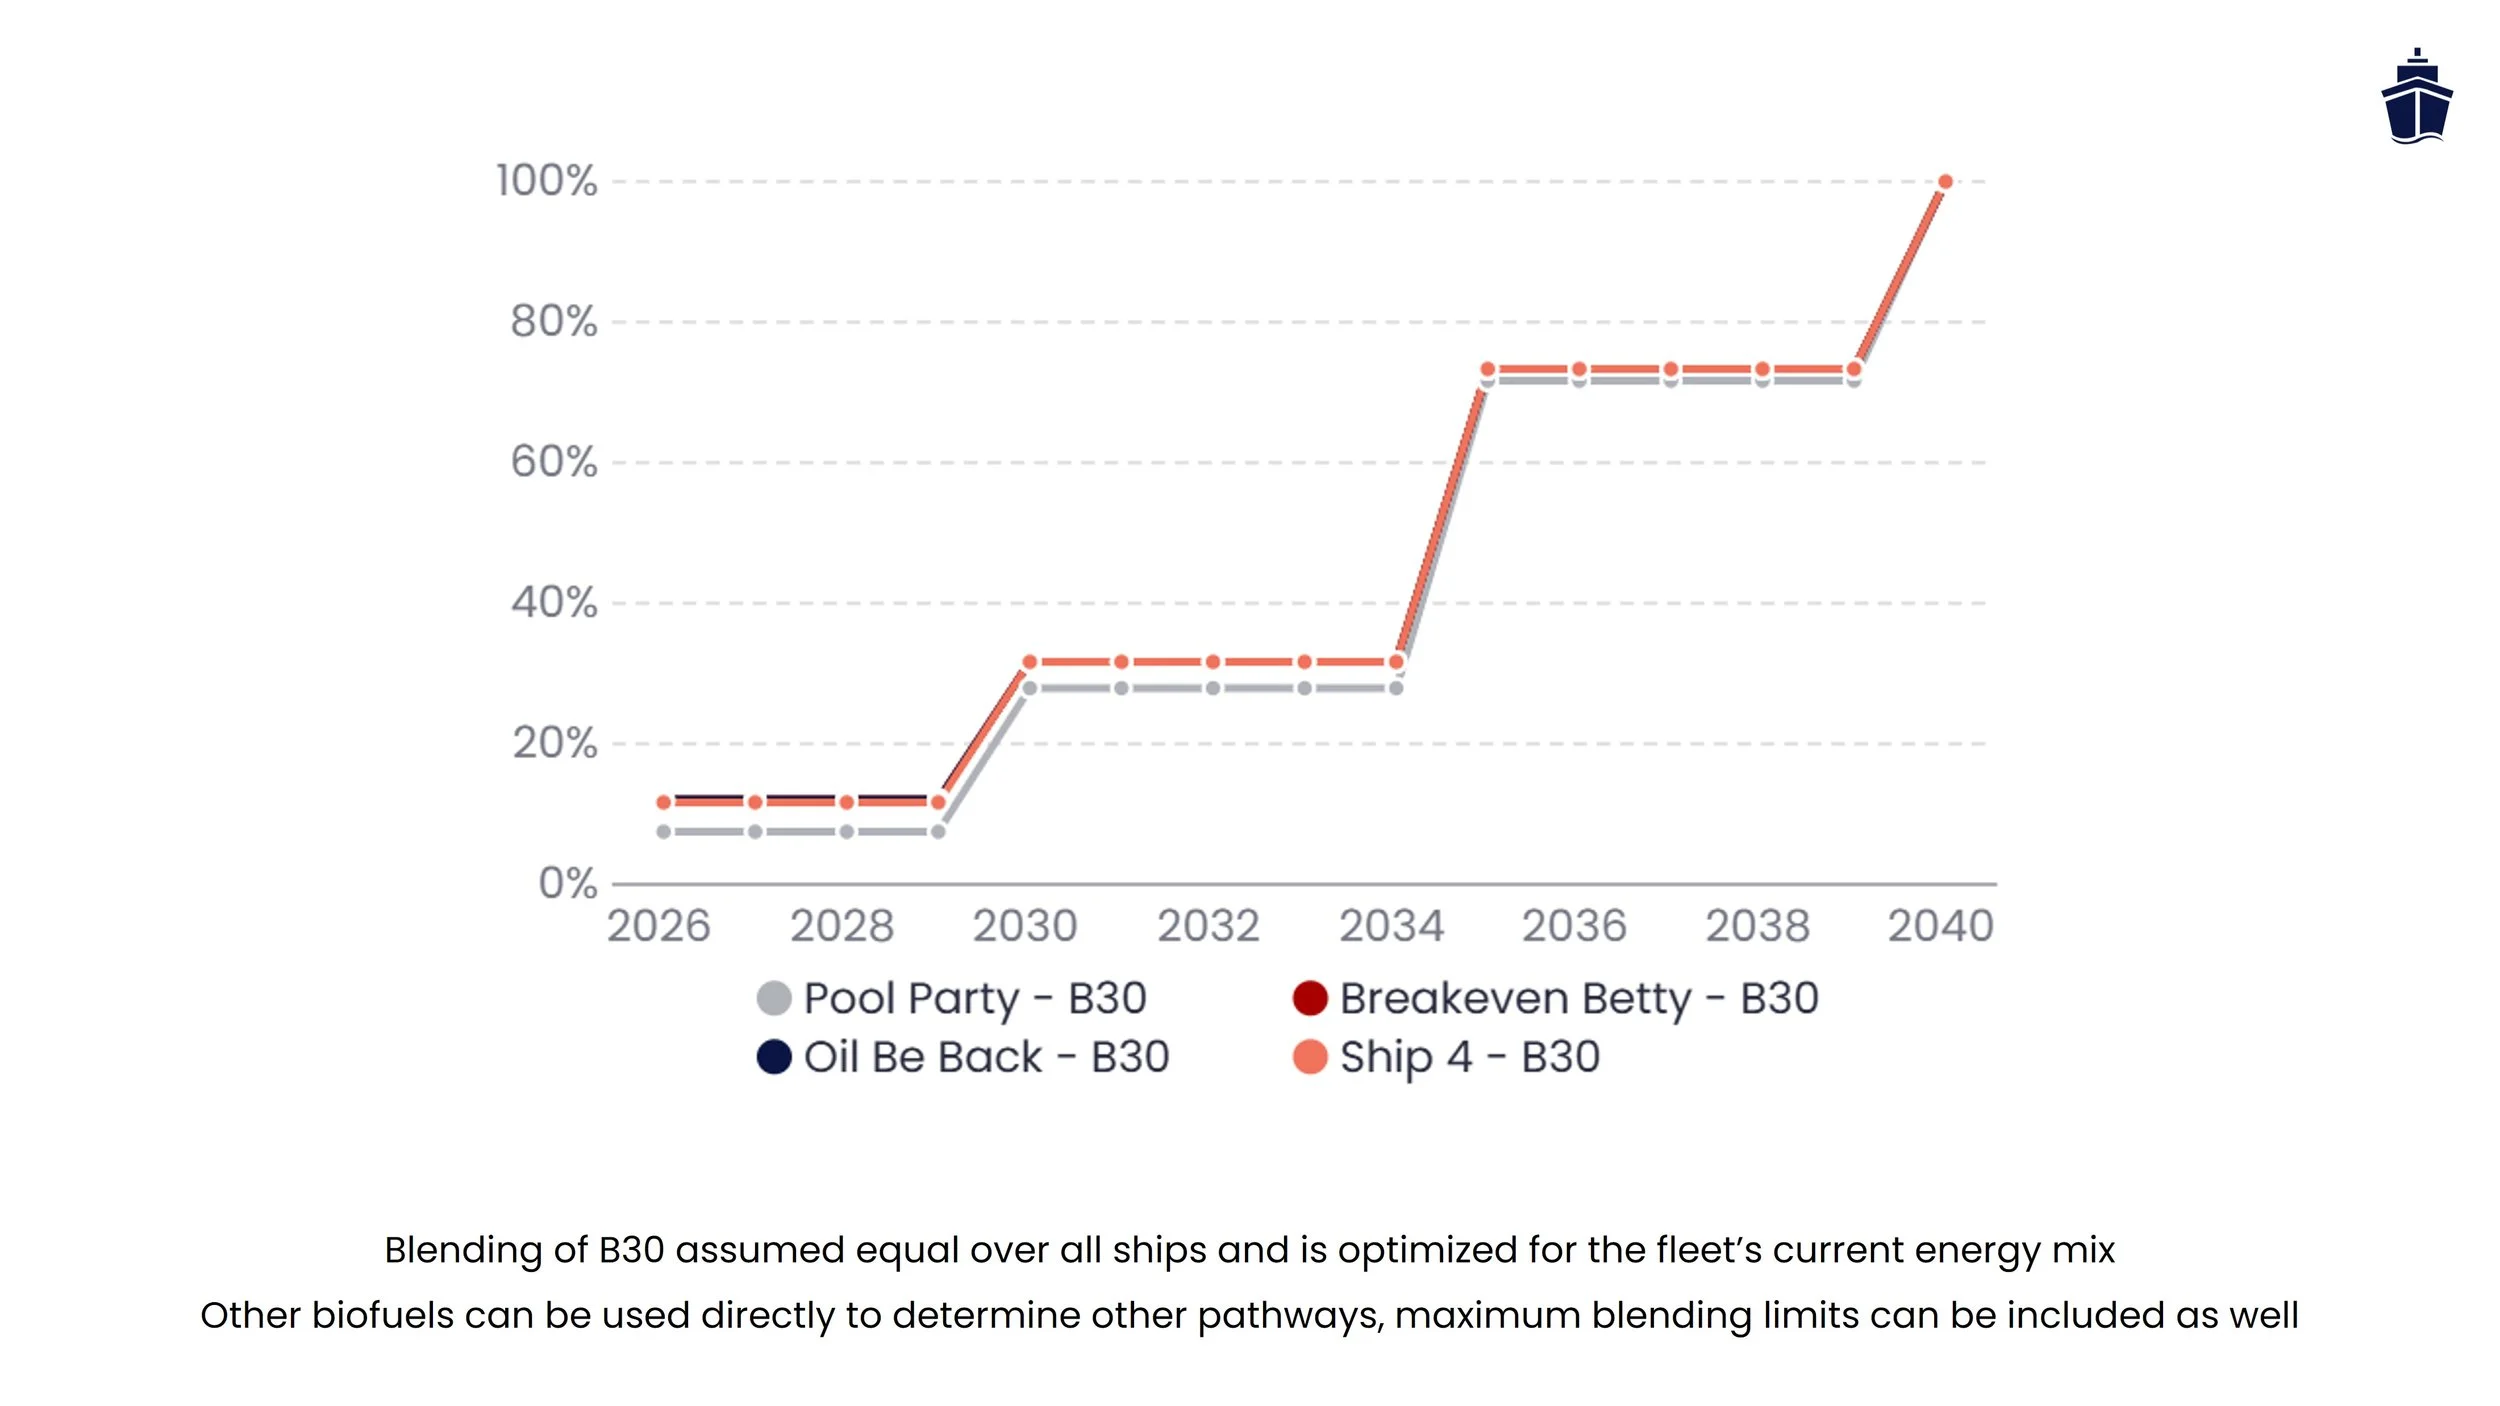
Biofuels are blended to hit the target exactly. For this analysis, a B30 blend is used as basis, which is a blend of 30% biodiesel (also called FAME) blended with 70% HFO. The resulting ‘B30’ is blended with the regular fossil fuel at the ratio needed to hit the FuelEU GHG-intensity target each year - no more, no less. In the base case that means roughly a ~10% usage of B30 in 2026–2029, rising to ~30% in 2030–2034, ~70% in 2035–2039, and effectively 100% B30 from 2040 onward. The cost lever here is almost entirely the biofuel price, so the sensitivity analysis is where this strategy lives or dies. For all intents and purposes, practical limitations of using biofuels at these levels are not considered, but this can be a real limitation pending on your Original Engine Manufacturer (OEM).
The results
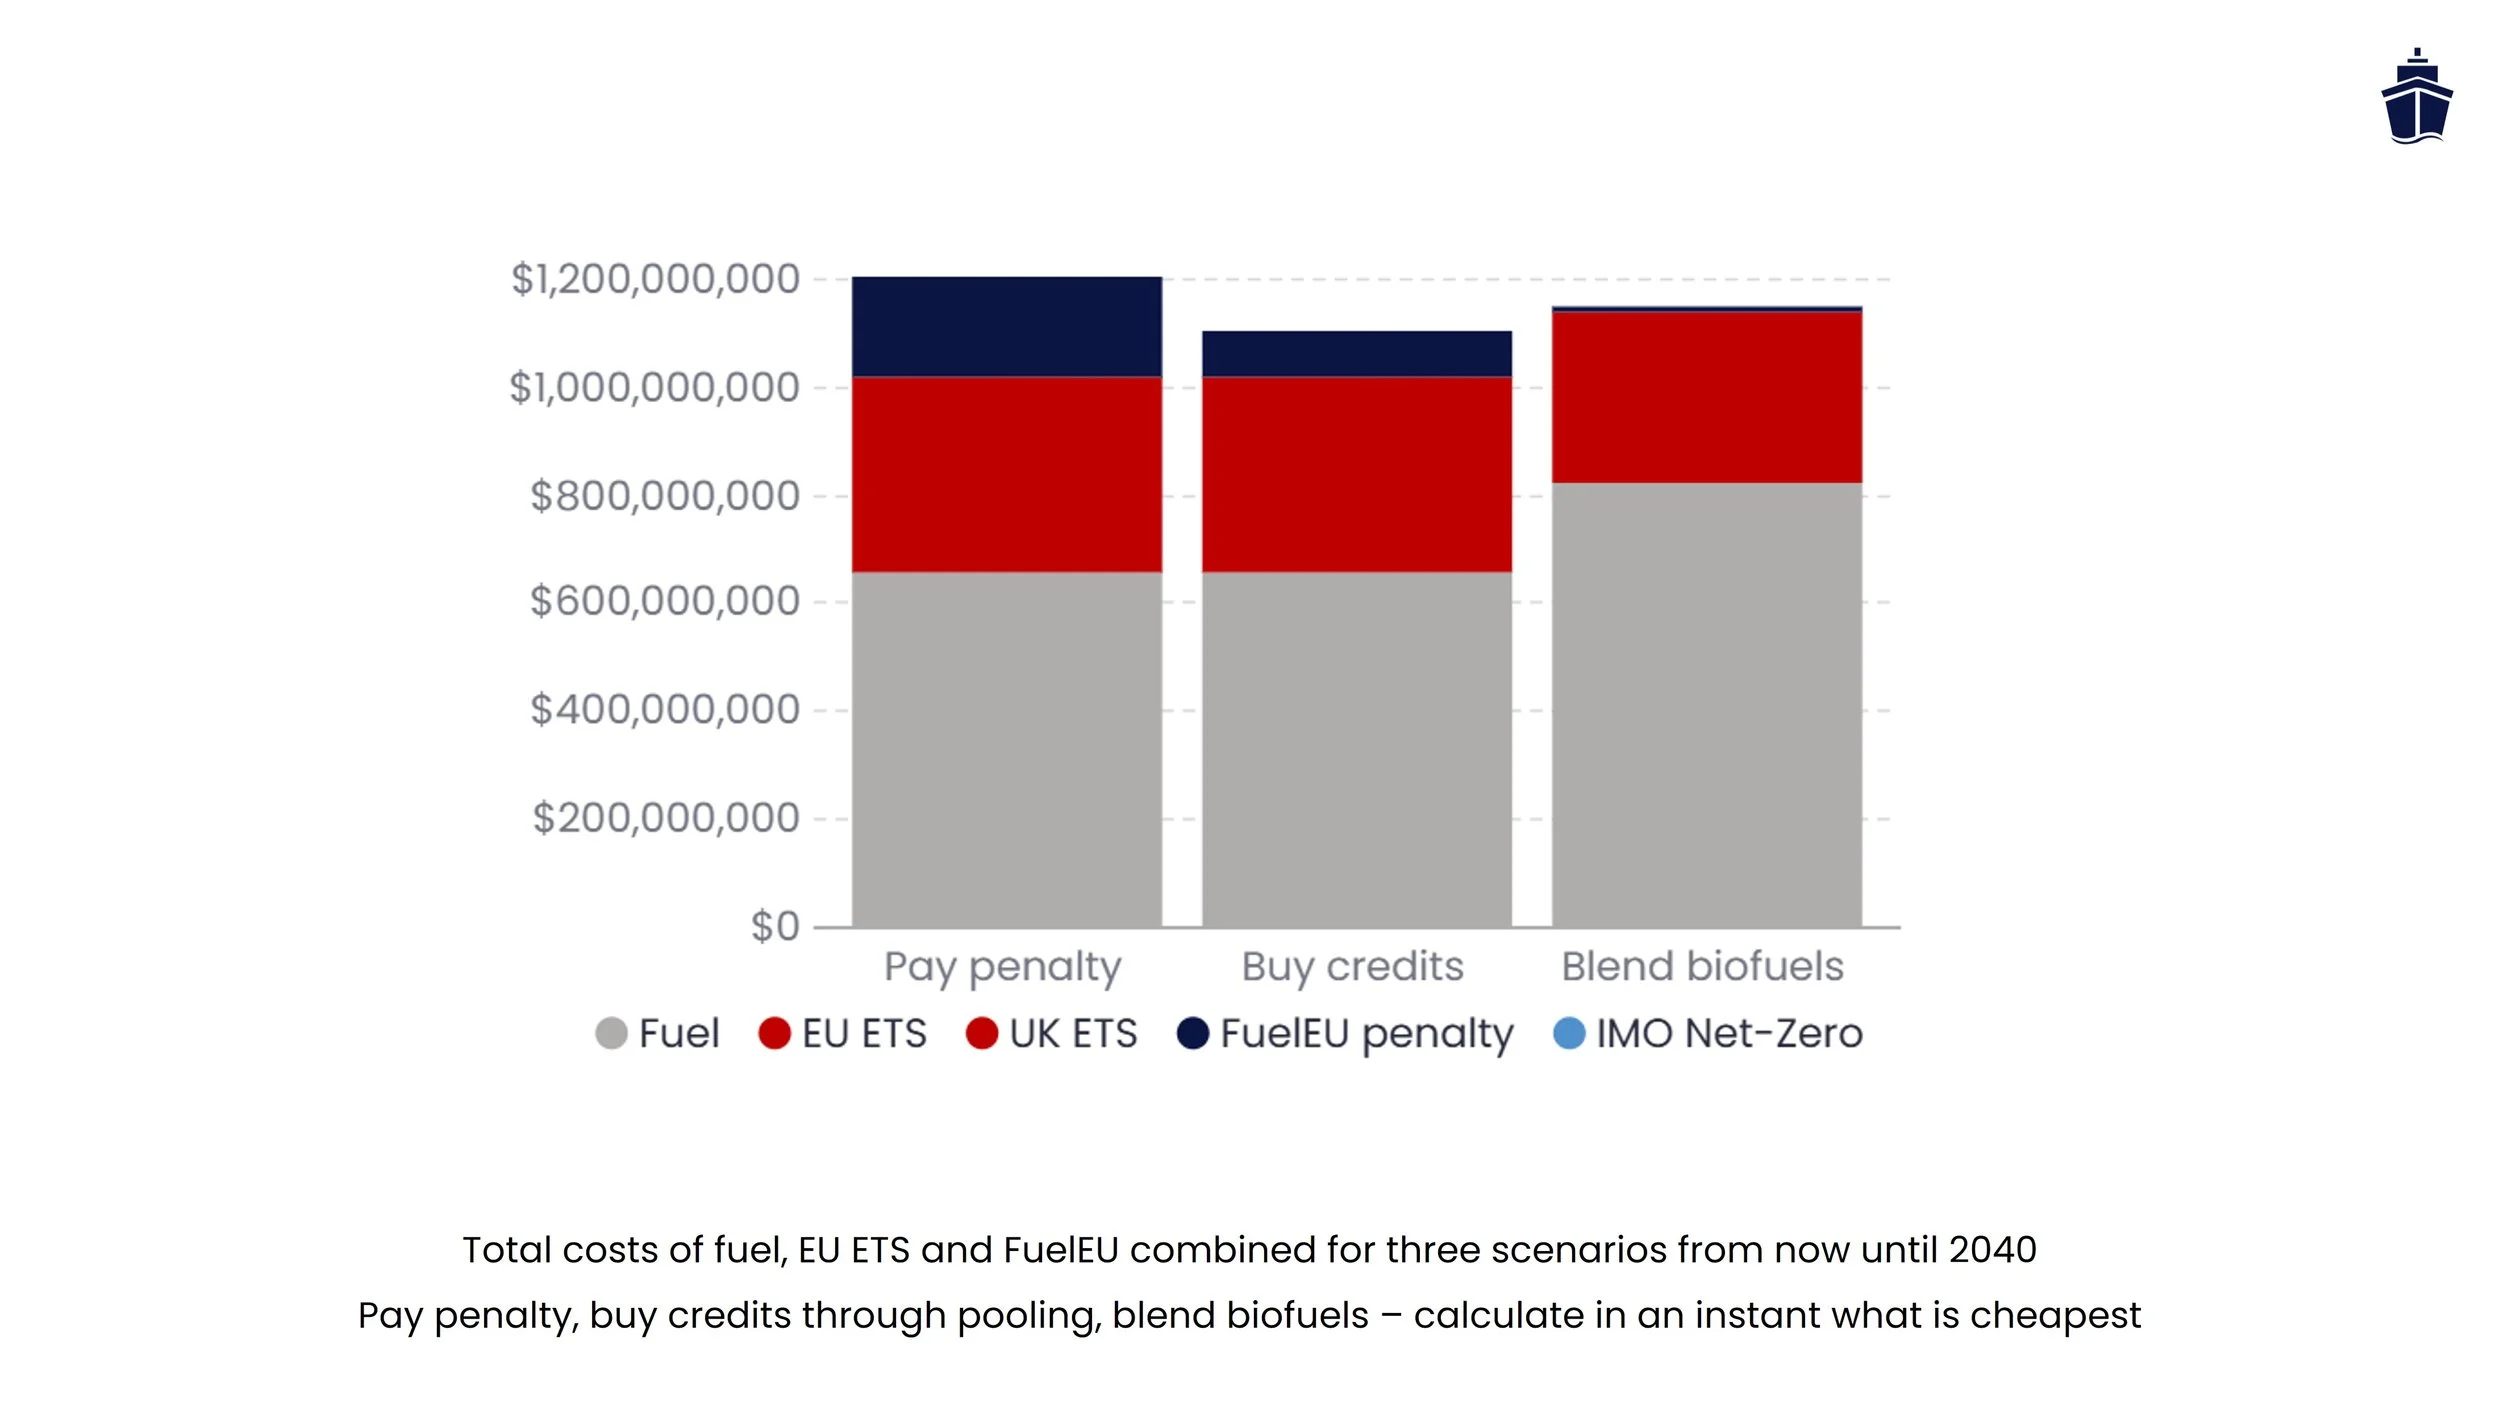
Total Cost Comparison (2026–2040)
Penalty: $1.205 B
Pooling: $1.106 B
Blending: $1.149 B
Pooling and biofuels both beat business as usual by roughly the same margin, and the gap between them is ~3%. On a pure-headline basis, it looks like a coin flip. Which is exactly why the sensitivity analysis matters more than the point estimate.
Key sensitivities
B100 price vs. FuelEU credits are the dominant variables. At our base-case $3,000 / mt, biofuels roughly match pooling. A $200–300 / mt swing in B100 is enough to flip which strategy wins over the 2026–2035 window. If you have a locked-in offtake at a lower price, biofuels are the clear winner; if you are exposed to spot price, pooling looks safer, especially when you can make long-term pooling arrangements.
The FuelEU target tightens sharply after 2035 (–31% in 2040, –62% in 2045, –80% in 2050). Towards 2040 the balance shifts toward blending because it is assumed pool credits get scarcer (and more expensive) as more shipowners hit deficit.
The analysis assumes a biofuel blend (B30) with HFO at 18 gCO₂eq / MJ per RED. Sustainability-certified feedstocks can come in lower, improving the compliance yield per tonne blended — which effectively cuts the biofuel cost per mTeq of compliance delivered. Worth verifying with your supplier.
Fuel volumes, HFO/MGO split, and EU jurisdiction share should be verified against actual voyage data before drawing firm conclusions. A fleet that's only 60% in EU waters looks very different from one at 100%. Operational impact on the engines has not been verified of course (!).
-
The analysis makes use of the FuelEU Pool Tool, which helps shipowners and operators evaluate the compliance and financial impact of pooling vessels under the FuelEU Maritime Regulation. By combining the GHG performance of multiple ships into a single pool, the tool calculates the pooled GHG intensity and determines whether the collective meets the regulatory target — allowing surpluses from over-performing ships to offset deficits from under-performers.
Users can compare pooled versus individual compliance outcomes, quantify potential penalty reductions or credit revenues, and explore how fleet composition and fuel choice affect regulatory exposure across the 2025–2050 analysis period. The tool supports scenario modelling and strategic planning by directly linking vessel-level fuel consumption to FuelEU cost implications, including the option to model biofuel blending as a compliance lever.
Designed for fleet managers, technical teams, and compliance officers, the tool simplifies pooling analysis and produces structured outputs that support internal decision-making, commercial planning, and regulatory engagement.
Cross-vessel compliance balancing — offset high-intensity vessels with low-intensity performers within the same FuelEU pool, before any penalty is applied.
Penalty and credit cost modelling — estimate total FuelEU penalties, credit revenues, or net pool savings under both pooled and individual compliance scenarios.
Optimal biofuel strategy at the push of a button — automatically calculate the most cost-effective biofuel blend per ship, balancing fuel cost against avoided FuelEU penalties to minimise total compliance cost across the pool.
Strategic pool composition — test the effect of adding or removing vessels, switching fuels, or applying biofuel blends to reach regulatory targets at the lowest cost.
Methodology and assumptions
The FuelEU Pool Tool enables shipowners and operators to evaluate the compliance and financial impacts of pooling vessels under FuelEU Maritime . By combining the performance of multiple ships, the tool calculates pooled GHG intensity and determines whether the collective meets regulatory thresholds, helping to balance over- and under-performing assets.
Users can compare up to three different scenarios, pooled versus individual compliance outcomes, estimate potential penalty reductions, and explore how fleet composition affects regulatory exposure. Designed for fleet managers, technical teams, and compliance officers, the tool simplifies pooling analysis and generates structured outputs to support internal decisions, commercial planning, and regulatory engagement. To unlock the full premium analysis, explore detailed assumptions, run personalized scenarios, or access our cost-benefit model to run your own, become a member.
-
Biofuel = B100 (Biodiesel or Fame)
Blending fuel = B30 (30% of B100 is mixed with 70% HFO to make blend)
Volume based blending (B30 means 30 m3 B100 and 70% HFO)
-
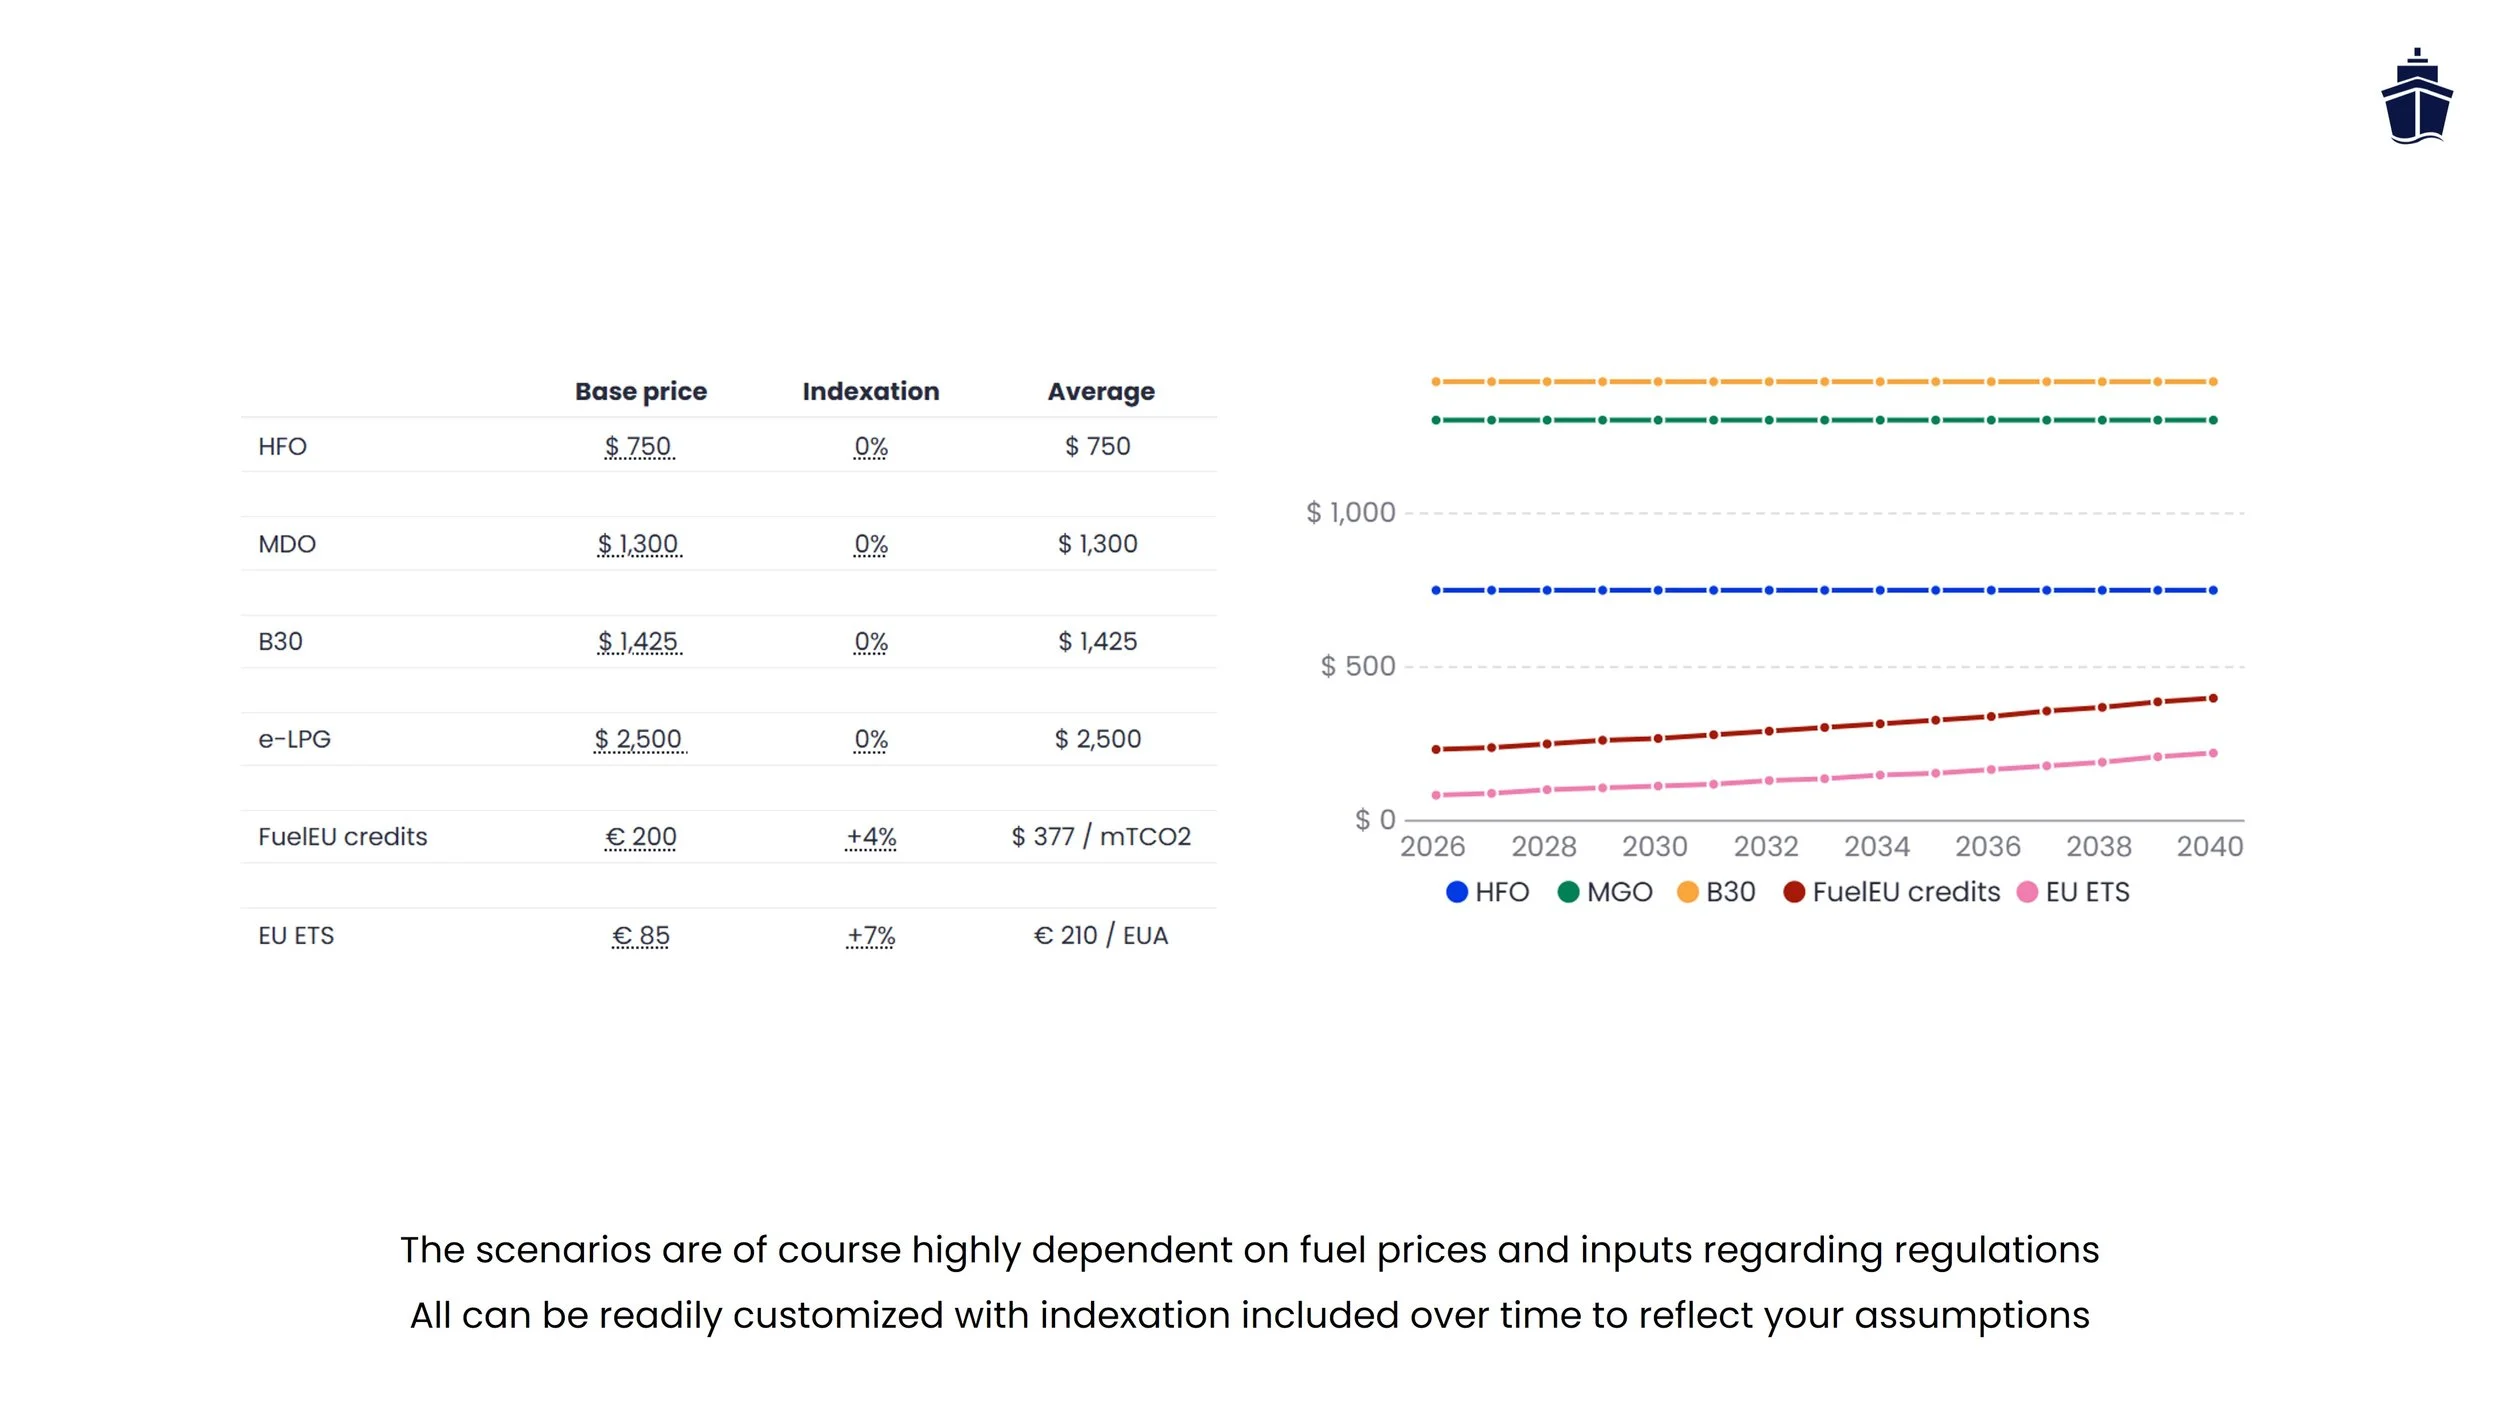
HFO = $750/mT
MGO = $1,300/mT
B100 = $3,000/mT
Fuel prices are kept constant until 2040
-
Credits = $200/mTCO₂eq (+4% annually)
EUA = €85 (+7% annually)
EU jurisdiction assumed at 100%
Upload your own fleet to get started today!
Premium tools and expert support at your fingertips
This Excel allows you to compare up to 10 ships to optimize your pooing strategy for FuelEU. It allows for different fuel options and blending settings, comparing fuel costs, EU ETS and FuelEU penalties after pooling. If needed, you can adjust the sheet to allow for 1,000 ships! The Excel includes a tutorial and the link to our FuelEU guide for free download, in addition to our free to use helpdesk for support. This purchase allows you to store your calculations, work offline anywhere plus compare different ship types and scenarios.
Use Apple Pay to purchase the Excel (only on iPhone) - contact helpdesk for payment by invoice
Don’t want to sign up? Check pay-per-use options
You might also like


This case study compares three compliance strategies for FuelEU (paying the penalty (business as usual), buying pool credits from a third party, and blending biofuels) for a representative 4-ship fleet over 2026–2040. Results show that pooling and biofuels both beat business as usual by 6–7%, but it is a coin toss on which is better for you. The outcome is highly sensitive to B100 price and tightens structurally in favour of biofuels after 2030, making this a tipping-point question rather than a one-off choice.