
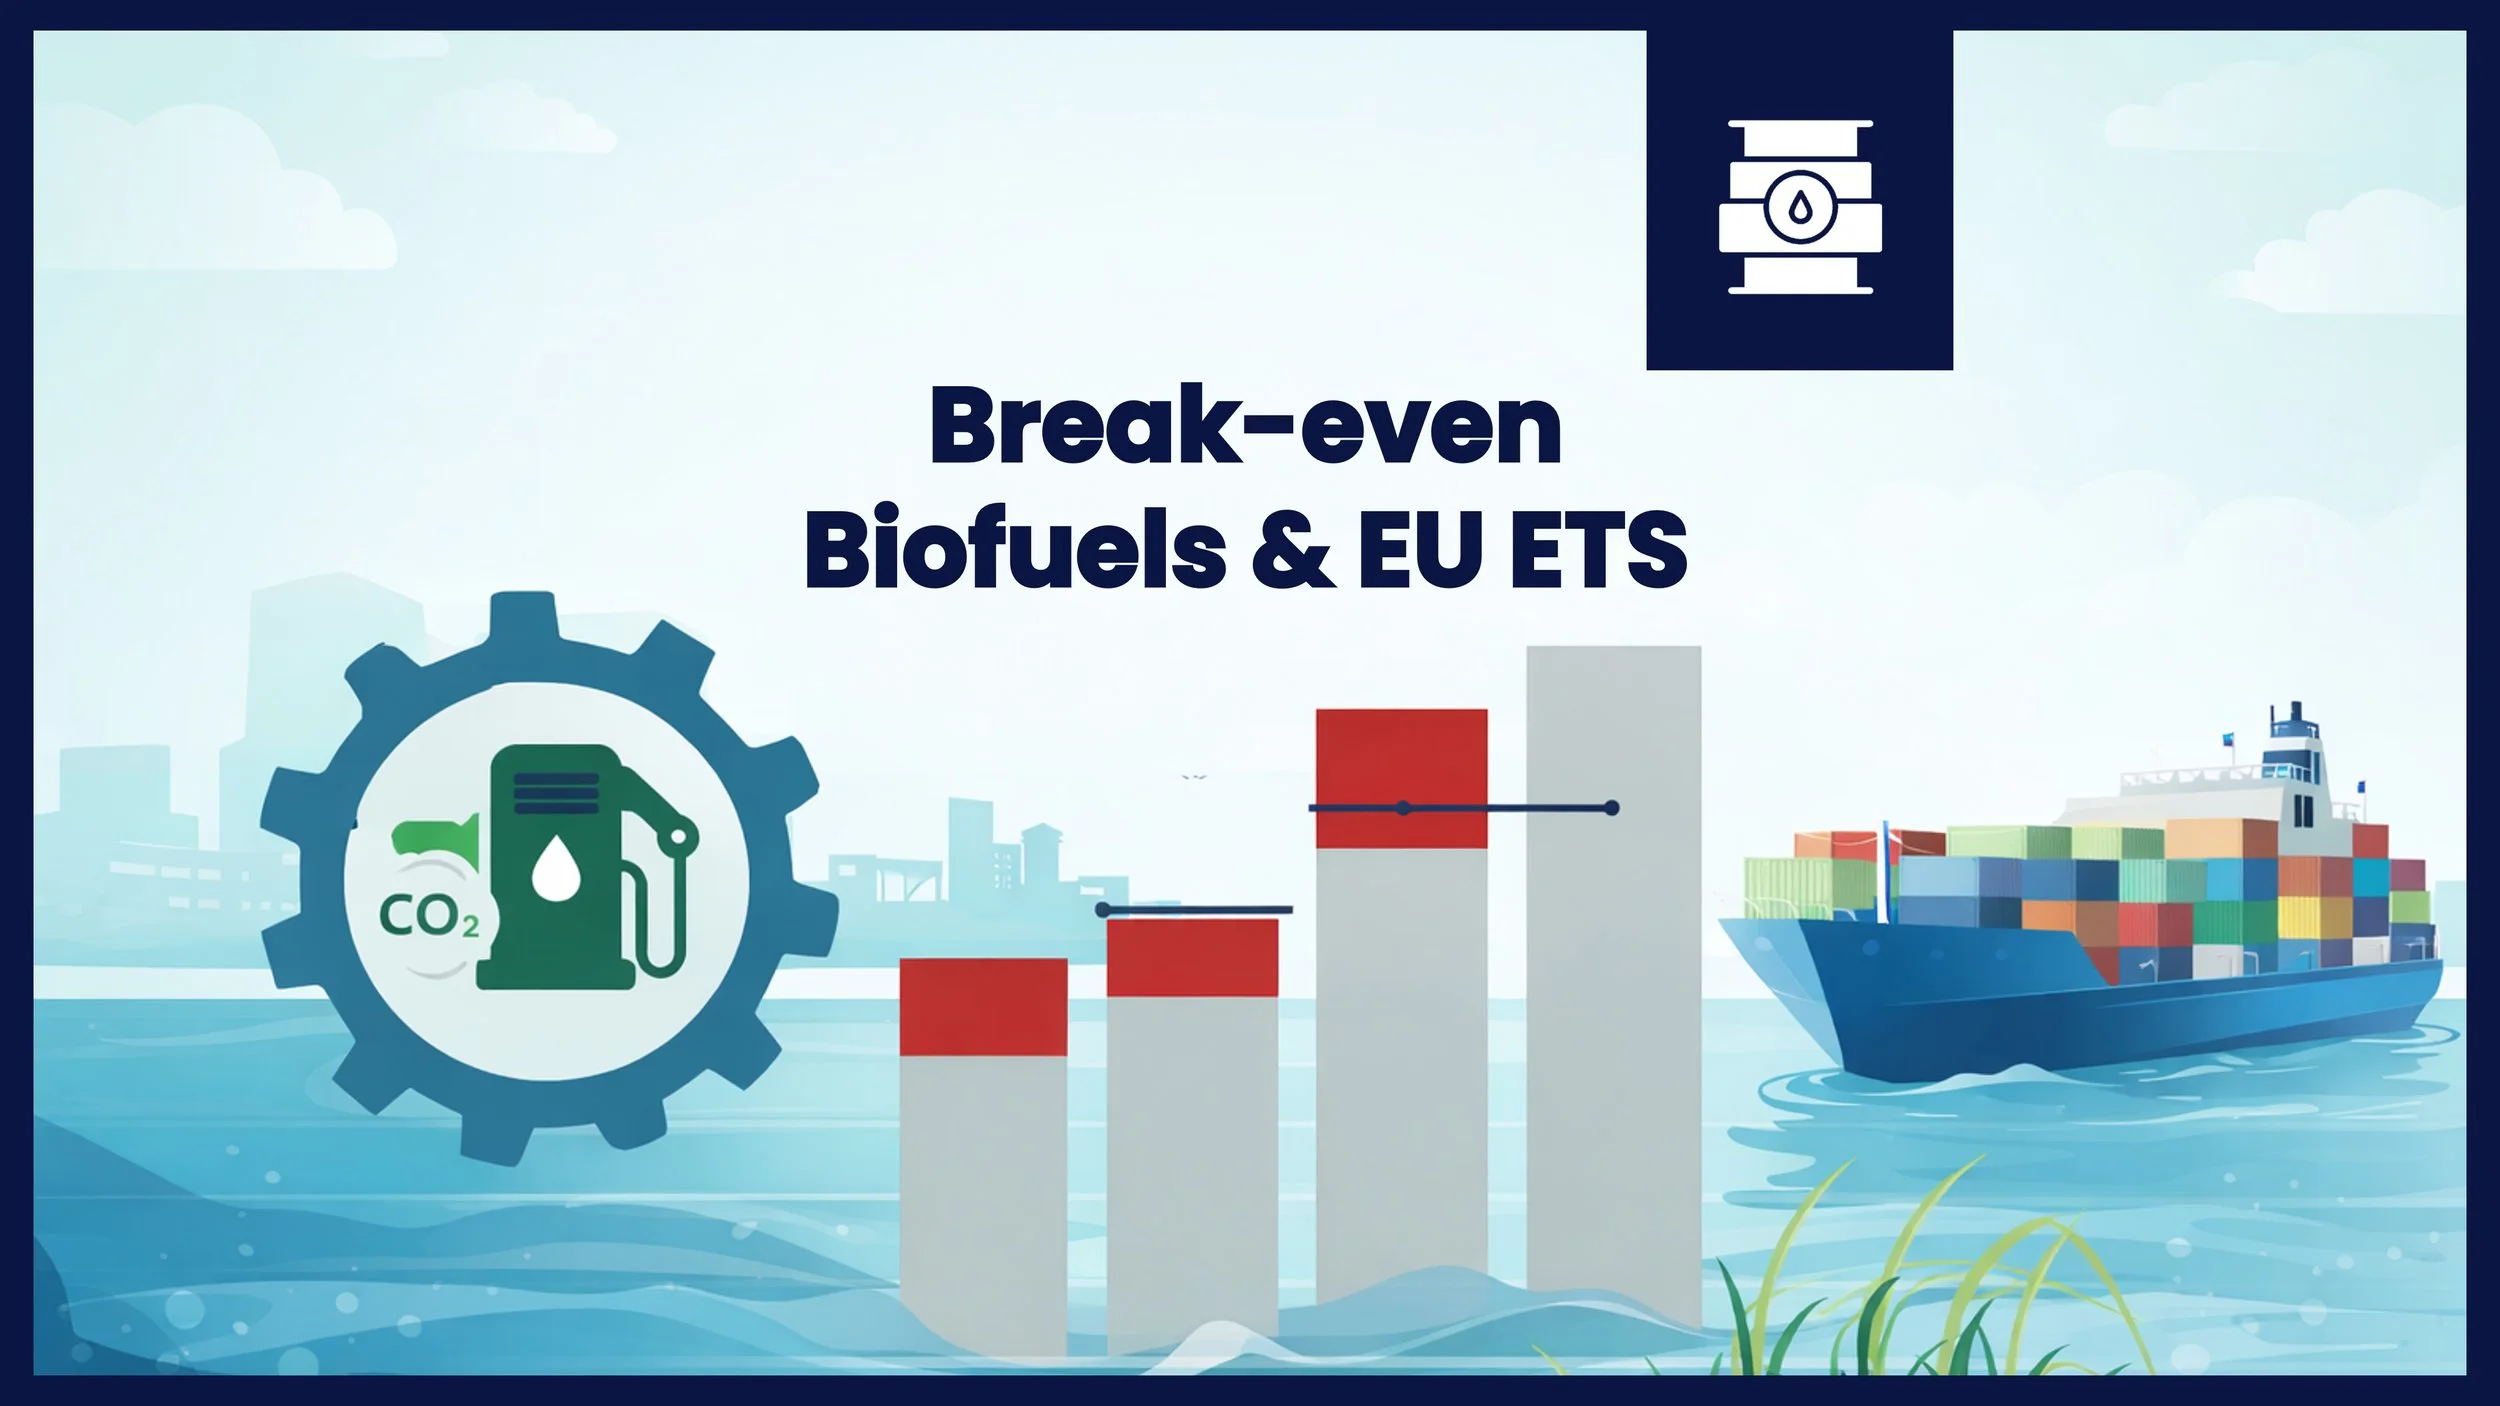
Compliance costs per mT of fuel from 2025 until 2050
Fuel prices expected to be more or less constant while compliance costs could surpass fuel costs by 2031
With IMO Net-Zero Framework on the horizon and FuelEU and ETS online, choosing the right marine fuel is no longer just about price per ton - it is about total regulatory exposure. FuelEU Maritime, the EU ETS, and the IMO Net-Zero Framework are driving long-term shifts in fuel competitiveness. To support shipowners, operators, and policymakers, Sustainable Ships has developed a tool that compares fossil and biofuels using VLSFO-equivalent energy cost as consistent benchmark.
The tool evaluates fuel cost components over time, including fuel price, EU ETS charges, FuelEU penalties or surpluses, and IMO GHG intensity compliance costs. Users can explore the impact of key variables such as time spent in EU waters, compliance periods, and carbon price assumptions. All fuels are normalized with respect to VLSFO (or LFO in FuelEU context) to deliver the same energy output, enabling like-for-like comparisons.
Initial insights indicate that if FuelEU Maritime and IMO Net-Zero remain unaligned (compliance with both frameworks is required independently) a tipping point is reached around 2031, where compliance costs exceed the underlying fuel price. If these regulatory frameworks are harmonized however, this threshold is delayed until 2040 approximately. Among fossil fuels, LPG and LNG currently offer the lowest total compliance costs, both in the short and long term. For biofuels, cost performance is primarily influenced by their FuelEU E-value, with the model showing a slight advantage for bio-LNG and HVO across most scenarios. Bio-H₂ can also perform well under the assumption of very low Tank-to-Wake and Well-to-Tank emissions, though outcomes are highly sensitive to these input values.
Explore the interactive model and assumptions in the sections below, and sign up to download the tool and databases themselves. Members and premium users can readily change, download and adjust all parameters in the model for their own analyses.


Members only
Methodology and assumptions
The analysis normalizes various marine fuels to deliver energy equivalent to one metric tonne of LFO (FuelEU reference at 41,000 MJ per mT), facilitating clear, accurate comparisons. Cost components considered include fuel prices, EU ETS costs, FuelEU penalties and surpluses, and IMO Net-Zero compliance costs. The model allows customization of scenarios, factoring in exchange rates, fuel types, regulatory costs, and sailing parameters, thus enabling stakeholders to see precisely how each factor impacts fuel competitiveness.
It is an OPEX driven model, no CAPEX costs for refits or engine modifications are included in the analysis. Blending of fuels is also excluded, thereby making it seem as if there is only a choice for a single fuel, which is absolutely not the case. More assumptions per item can be found below. Explore the full scenario possibilities using the interactive tool, and contact Sustainable Ships for strategic support and tailored analyses to navigate your fleet through the regulatory seas ahead.
-
A modified version of the Fuel Cost Calculator was used for this analysis. This tool compares compares fuel costs, EU ETS costs, FuelEU penalty and pooling benefits if applied. This tool helps shipowners, operators, and fuel suppliers assess the economic impact of different fuel choices while considering regulatory developments, in particular FuelEU Maritime and EU ETS.
The tool allows for a scenario-based analysis, allowing you to explore predefined fuel price evolutions (Steady State, Fossil Future, Biofuels Better, and Renewable Rise) or define your own price trends. It also enables dynamic selection of a start and end year, so you can focus on specific time ranges to analyse fuel cost evolution. A report of your analysis can be printed and shared to showcase different options all the way up to C-level for strategic decision-making purposes. In short, you can use the tool for …
Operational Cost Forecast – Project fuel costs over time, incorporating EU ETS and FuelEU penalties or pooling benefits.
Regulatory Compliance Assessment – Determine the cost implications of EU ETS and FuelEU Maritime penalties and identify cost-saving strategies.
Investment Case Report – Create a structured analysis to present fuel cost scenarios and regulatory impacts to decision-makers.
Feasibility Study – Assess the financial and regulatory impact of switching to alternative fuels before making investment decisions.
Fuel Cost Benchmarking – Compare fuels on an energy-equivalent basis to understand which is most cost-effective for specific routes or operations.
-
Each regulation (FuelEU, EU ETS and IMO Net-Zero) has its own specific set of fuel properties and values. In other words, LCV, emission factors (Cf), WtT and TtW emission factors in MJ per gram fuel can all be different for the different regulations. The values used for the analysis can be seen in the tool under fuel properties. The following points should be noted:
Slippage for all regulations is assumed 0.20% m/m, which is quite low and conforms to a dual fuel slow speed engine.
Butane is used as basis when LPG is considered.
The Global Warming Potential (GWP) for CH4 and N2O is assumed to be 28 and 265 gCO2eq per gram fuel respectively, as per IPCC AR5.
For FuelEU penalties, the E-value for biofuels is of critical importance. This is the total WtW emission factor as per the Renewable Energy Directive and has been assumed 18 MJ per gram biofuel for all biofuels used. This is typically low and means that high-grade biofuels are taken in consideration for this analysis.
Where values are unknown or not determined (LCV, WtT or specific CO2, CH4 and N20 emission factors) typical values provided from other regulations are taken. For example, TtW emission factors for biofuels in IMO-Net Zero are mostly unknown, thus FuelEU values are taken.
-
In the basic model setup, a flat rate with current prices are used for modelling. In the downloadable model however, fuel price projections are based on several pricing scenarios from 2025 to 2050 and a variety of sources, including DNV, IEA, Enerdata, Bloomberg and others. Fossil fuels like LFO and HFO maintain lower initial prices, around $700 per metric tonne, but their costs rise significantly under regulatory pressures. Alternative fuels present varied scenarios; Bio-LNG starts around $1,250 per metric tonne, and Bio-H2 peaks sharply at $3,800 per tonne, reflecting current production and scalability challenges. These scenarios underline the trade-offs between fuel price stability and regulatory compliance.
-
The current model assumes a starting price of €75 per EUA (European Allowance), increasing yearly with 5%, as per projections of Bloomberg, Enerdata and Maersk McKinney Moller, who all estimate the cost of EUAs to rise up to €300 to €500 per allowance. This results in EU ETS adding a considerable cost pressure. With current prices and at the time of writing, EU ETS costs for fossil fuels are approximately $150 - $200 per mT fuel equivalent. This is expected to rise to almost $1,000 per mT equivalent in 2050, substantially raising operational costs. With the current legislation, biofuels are exempt from TtW CO2 emissions, which makes them more or less "immune" to EU ETS.
-
FuelEU costs can be clearly modelled for fossil fuels and biofuels as most fuel properties are known. A critical impacting parameter for biofuels is the “E-value”, or the total Well-to-Wake greenhouse gas intensity of the fuel as per the Renewable Energy Directive, expressed in grams of CO₂ equivalent per MJ of energy.
The E-value determines how a fuel compares to the annual GHG intensity target set by FuelEU. If a fuel’s E-value is above the target, it incurs a penalty per tonne of CO₂eq emitted in excess. If it falls below the target, the operator can generate surplus credits. Therefore, accurate knowledge of the E-value - covering both upstream (Well-to-Tank) and combustion (Tank-to-Wake) emissions - is essential for calculating compliance costs or potential surplus revenues under the regulation. Small changes in assumed upstream emissions can shift a fuel from compliance to penalty, making the E-value a cornerstone of strategic fuel selection.
Within the FuelEU framework, traditional fossil fuels face escalating penalties, directly increasing operational costs, particularly as emission targets become stricter over time. Conversely, fuels that perform better than regulatory standards can generate surplus credits, which operators can leverage to offset penalties elsewhere in their fleet.
Pooling is a key strategic element of FuelEU, allowing fleet operators to aggregate emissions performance across multiple vessels. This mechanism enables the balancing of surpluses generated by high-performing vessels against deficits from less efficient ones. While pooling significantly enhances compliance flexibility, quantifying its exact impact can be challenging due to fleet composition, operational diversity, and variability in vessel deployment.
The model currently assumes a conservative surplus valuation at about 50% of the penalty (€300 per mT CO2eq), providing a realistic and cautious baseline for decision-making. For biofuels, a rather low E-value is assumed which makes them much more attractive with regards to penalties. Adjust the values in the premium model to discover the impact of different types of biofuels.
-
Under IMO’s framework, increasingly stringent GHG intensity targets will drive compliance costs upward from 2028 onwards. The model clearly illustrates how fuels like LNG and methanol initially competitive become costly as IMO targets intensify. Conversely, zero-emission fuels, despite their higher upfront costs, increasingly provide regulatory cost stability, highlighting their long-term value in a net-zero shipping landscape.
Sign up for premium tools and benefits
This purchase allows you to compare the cost of Very Low Sulphur Fuel Oil (VLSFO) with other fuels on an energy-equivalent and total cost basis. It includes scenario-based fuel price projections, regulatory cost assessments for EU ETS and FuelEU Maritime, and the ability to define custom price trends. Easily generate operational cost forecasts and investment case reports to support strategic decision-making.
Use Credit card, Stripe, PayPal or Apple Pay (only on iPhone). Contact the helpdesk for payment by invoice.
Don’t want to sign up? Check pay-per-use options
References
Sustainable Ships - FuelEU Maritime
Sustainable Ships - EU ETS
Sustainable Ships - IMO Net-Zero Framework
You might also like


This Q&A session explores how transition fuels can support maritime decarbonization today, without major retrofits or new infrastructure. Together with Quadrise, we discussed MSAR® and bioMSAR™, oil-in-water emulsion fuels designed to improve combustion, reduce emissions, and support compliance under EU ETS and FuelEU Maritime. Relevant for shipowners and operators seeking practical solutions for the existing fleet.