
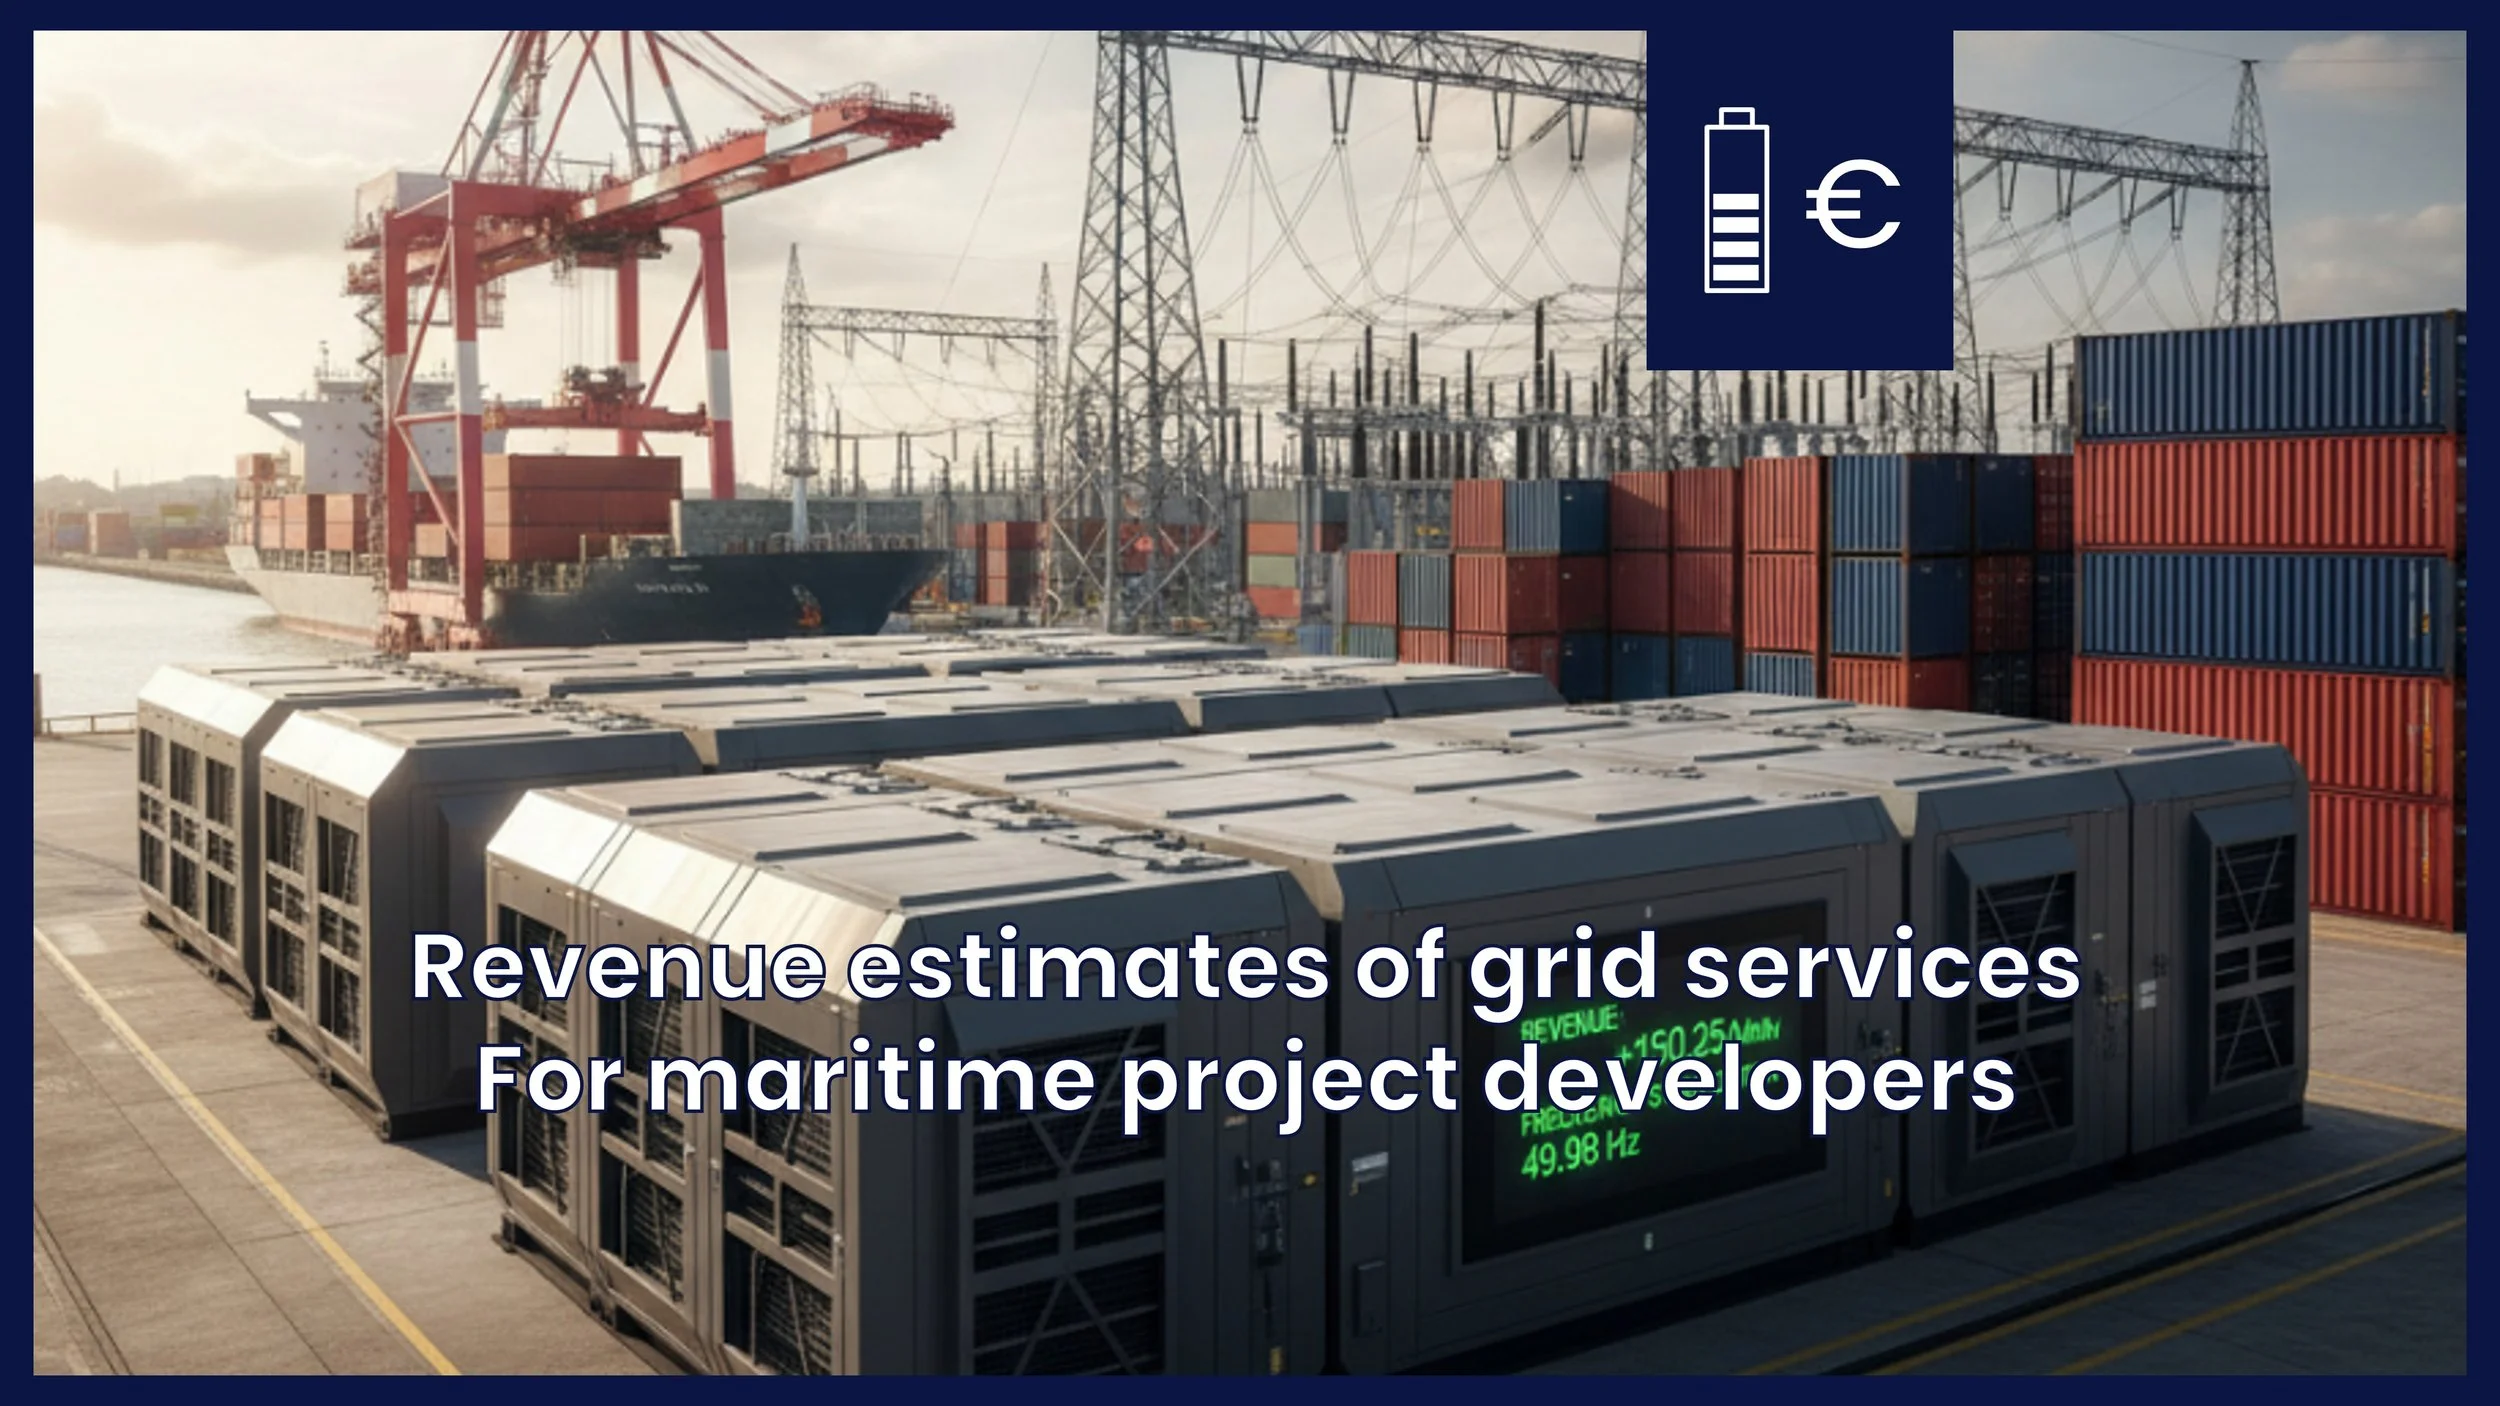
How Energy Storage Earns Money from the Grid: A Developer's Guide to Grid Services Revenue
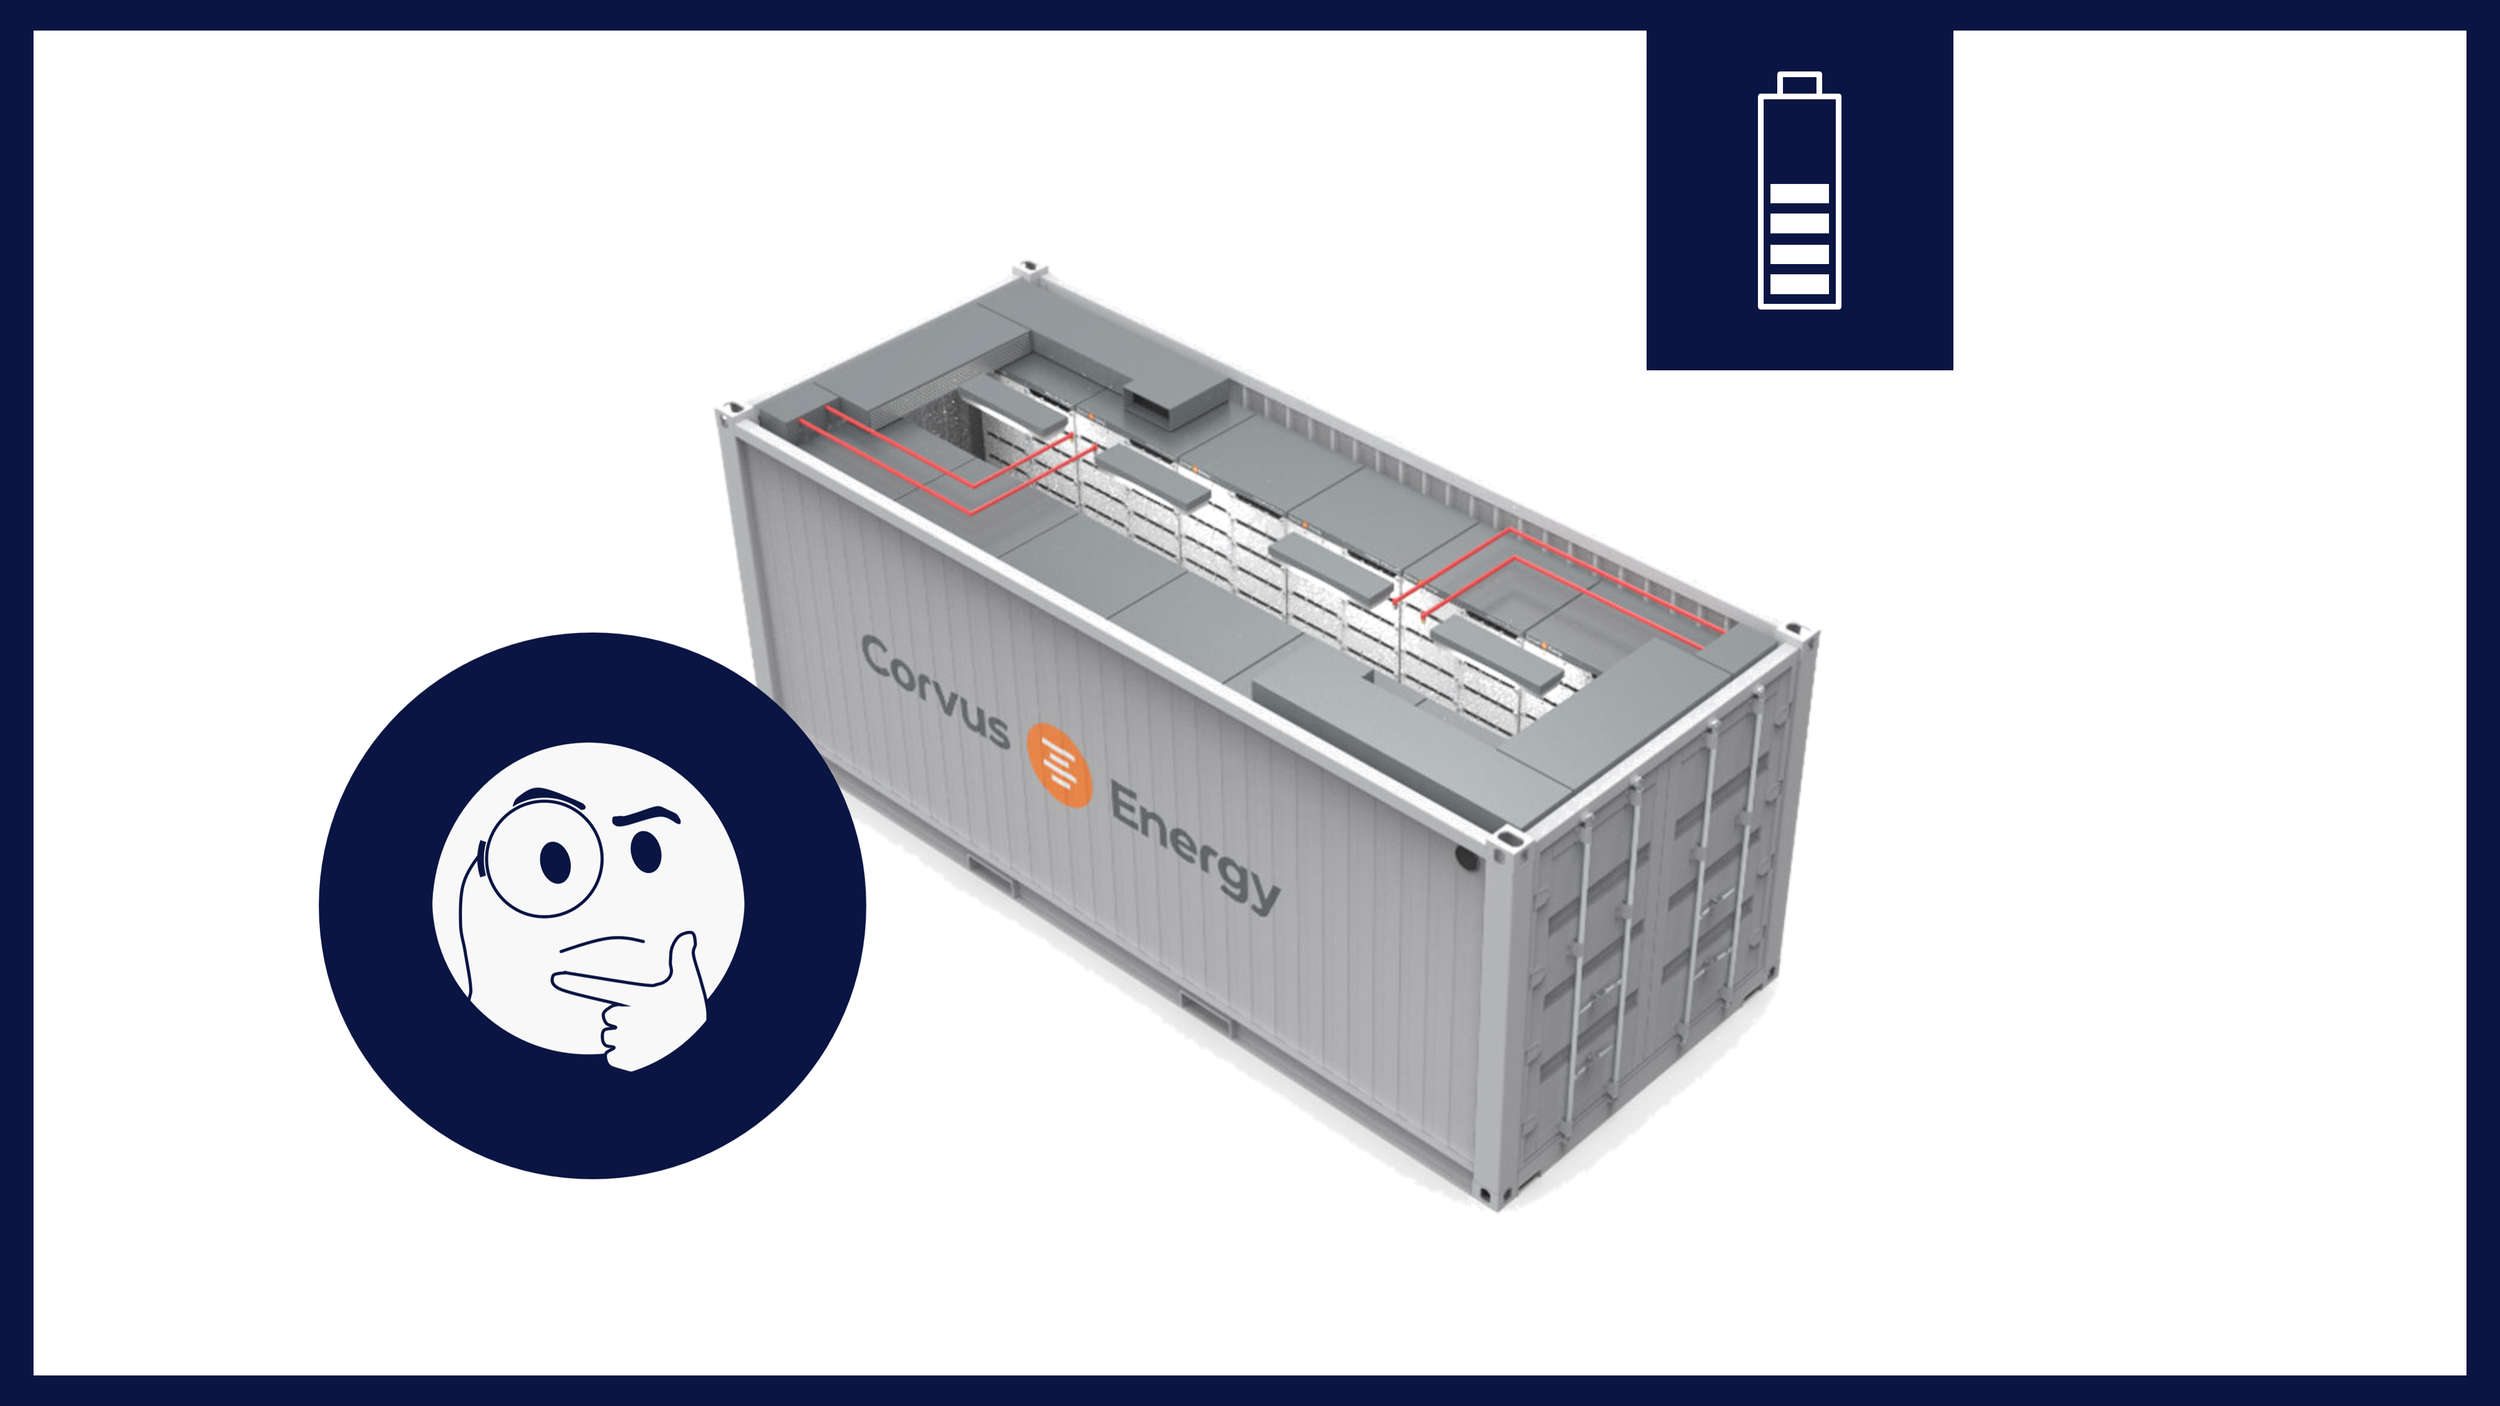
Guidance on how to create revenue by means of ‘grid services’ for developers of (OPS) projects with battery energy storage
The European electricity system is undergoing rapid transformation. The growing share of renewable generation, the electrification of industry and mobility, and the limited pace of grid expansion have created structural challenges. Grid congestion has become a daily reality in many countries in the EU, system imbalances are increasingly volatile, and electricity prices fluctuate more sharply than ever before. This volatility creates opportunity.
Flexible assets such as battery energy storage systems can earn revenue by stabilizing the grid, trading on price spreads, and relieving local congestion. However, the markets that enable these revenue streams are fragmented, technically complex, and unevenly documented. Reliable revenue estimates are difficult to obtain, technical requirements vary per service, and information is scattered across TSO documents (Transmission System Operator), exchange platforms, and aggregator websites. What are they and how to make sense from non-sense?
This article provides clarity for developers and asset owners with a structured overview of the ‘grid services’ available in North-western Europe. It tells you how to make money in the balancing, trading, and congestion management markets. The aim is to give the reader a practical foundation for evaluating energy storage opportunities, without having to piece together fragmented sources. The audience are project developers in North-westernEurope, in particular developers in a port environment. Check out the latest version of the Grid Services Guide for more information.
-
The Grid Services Guide provides a structured reference for navigating the markets that determine battery storage revenue across Northwest Europe. Drawing on TenneT, ENTSO-E, EPEX SPOT, GOPACS, and the EU Network Codes (EB-GL, SO-GL, RfG), the guide documents the three main grid service categories balancing, trading, and congestion management and sets each market side-by-side with its technical requirements, revenue mechanics, and access models, showing where opportunities lie, where the constraints bind, and what the differences mean for asset economics.
Rather than treating grid services as a single revenue stream, the guide anchors each market in its commercial consequence: the wrong product choice can mean the wrong technical requirements, the wrong revenue assumption, and the wrong investment case.
Market scoping – Determine which products fit your asset: FCR, aFRR, mFRR, day-ahead, intraday, or congestion management.
Technical requirements – Detailed specifications for prequalification, telemetry, response times, and minimum bid sizes across all balancing products.
Market access models – Compare direct BSP, aggregator, and supplier pass-through routes, with practical guidance on which fits which asset profile.
FAQ and definitions – Resolve common ambiguities with authoritative source citations from TenneT, ENTSO-E, and the EU Network Codes.
What exactly are grid services?
Services that insure that our electricity grid functions correctly: balancing, trading and grid congestion markets
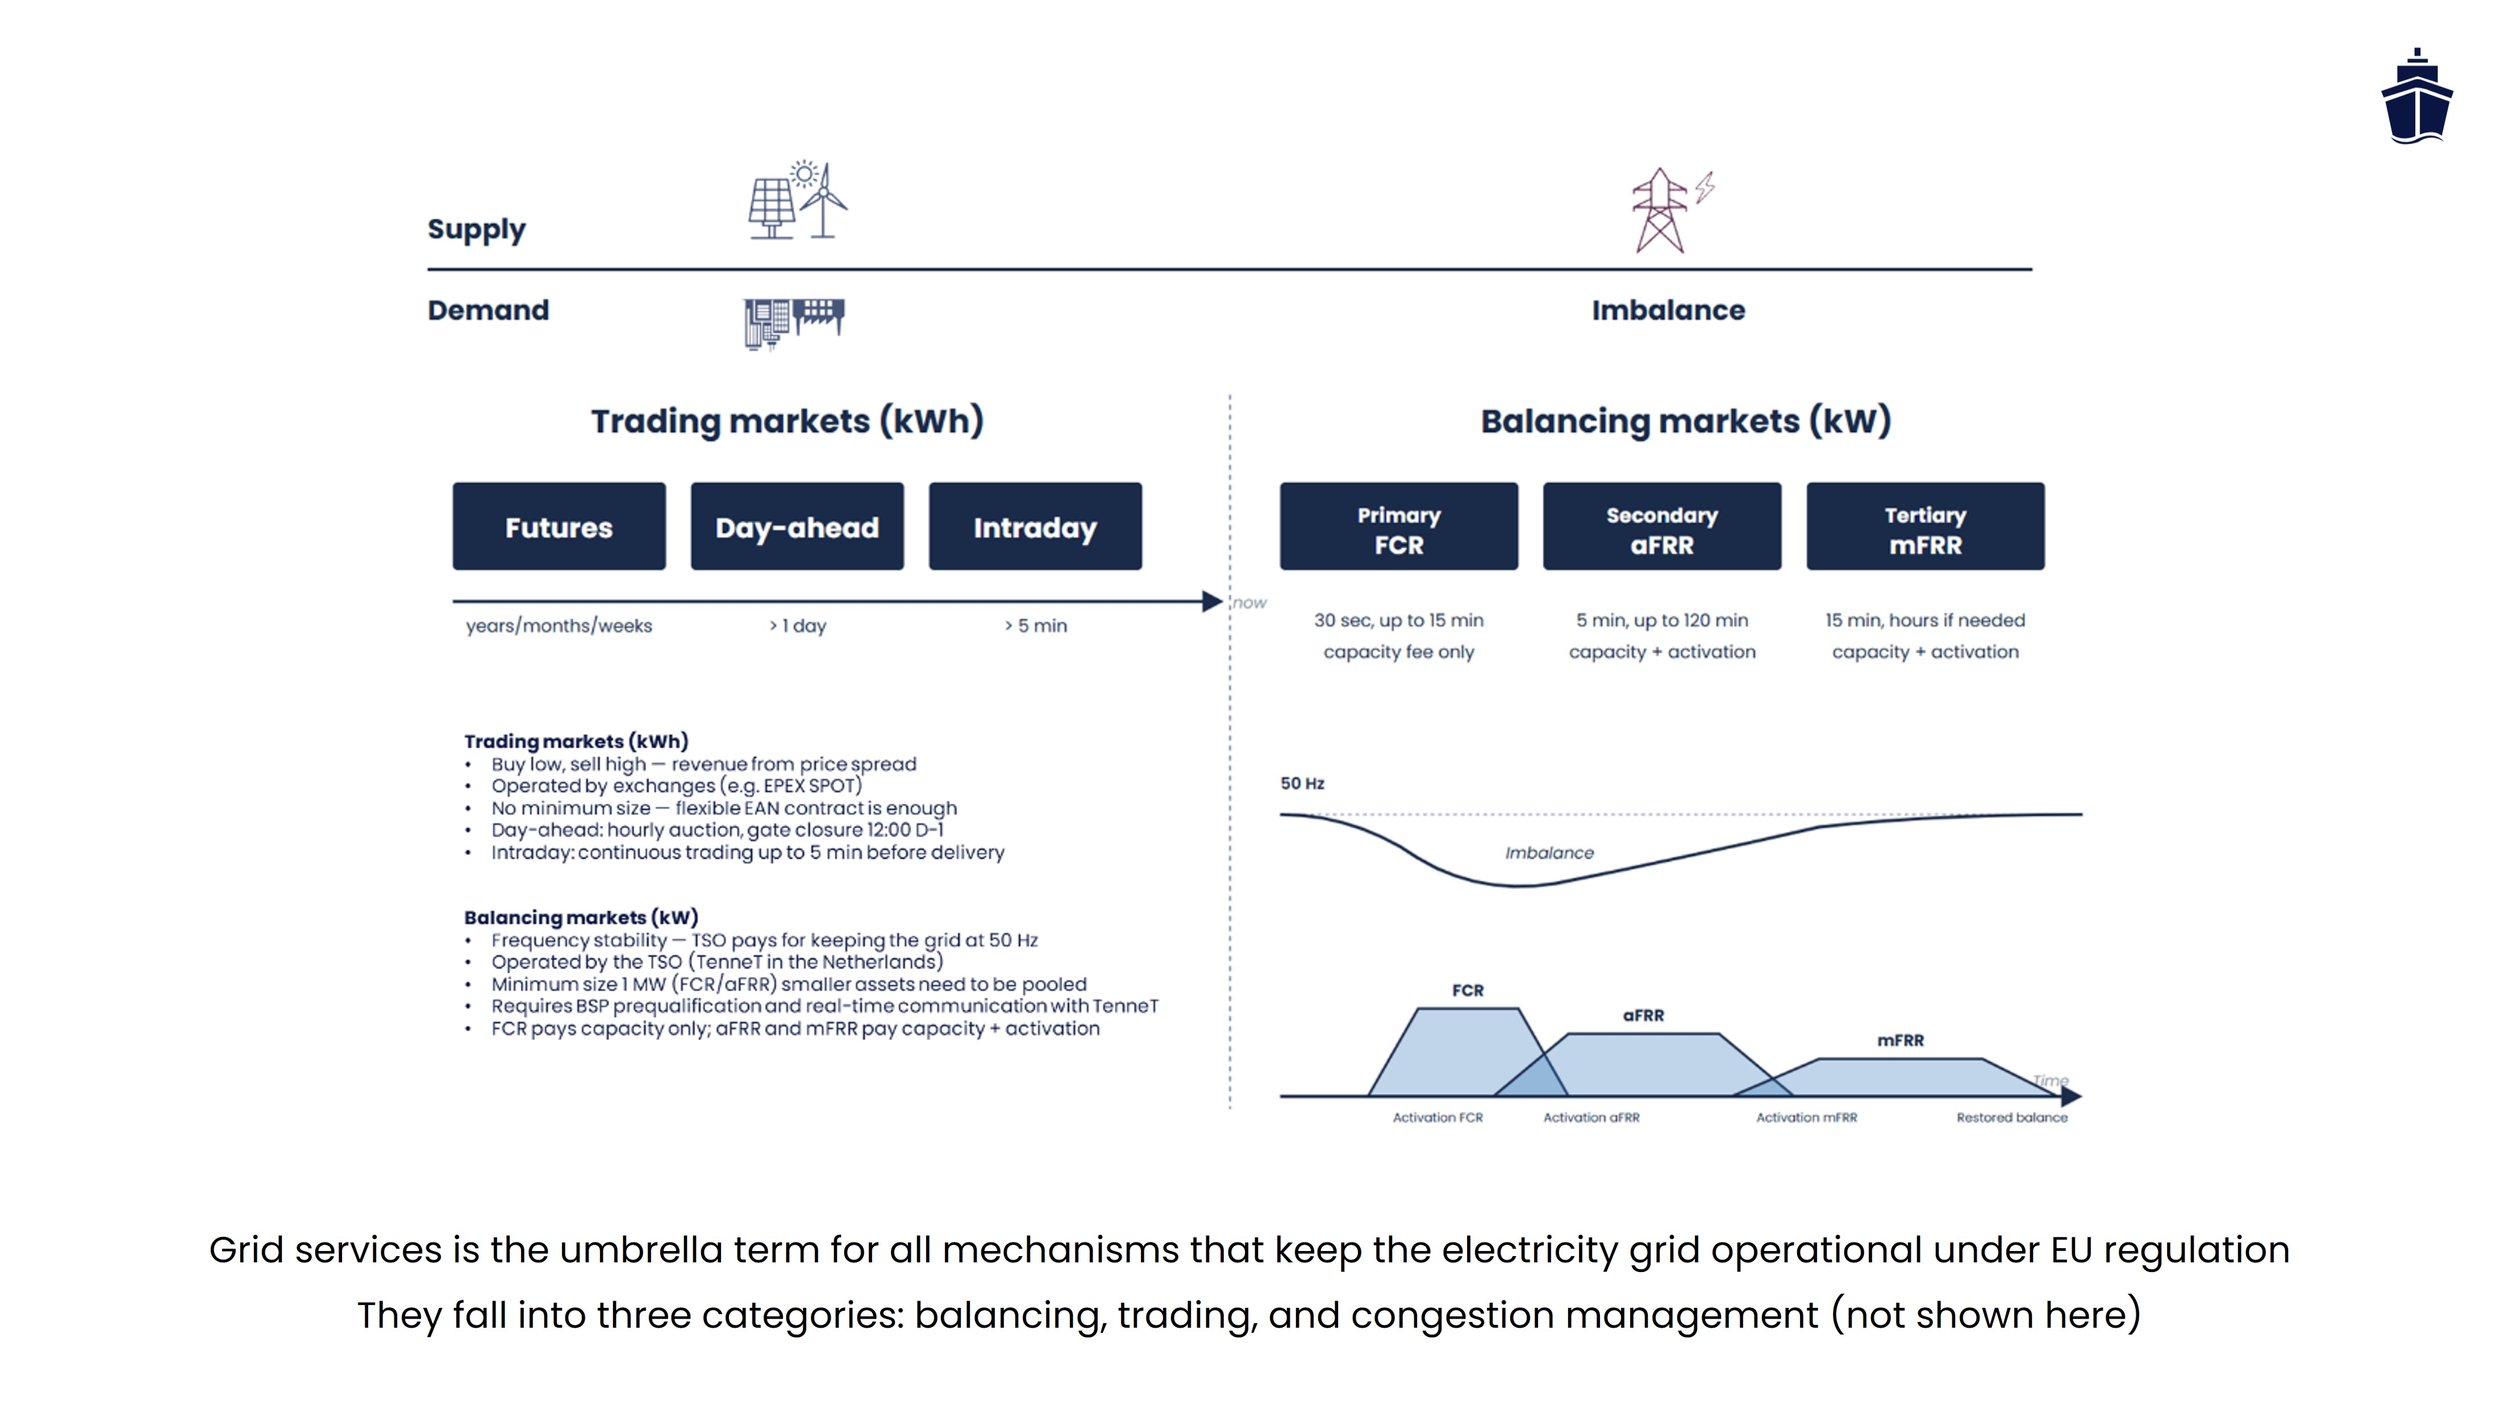
Grid services is the umbrella term for all mechanisms that keep the electricity grid operational under EU regulation. They fall into three categories: balancing, trading, and congestion management.
1. Balancing Markets (keeping the grid frequency stable)
The Transmission System Operator (TSO) balances supply and demand in real time by paying flexible assets to inject or absorb electricity. Balancing is divided into three products, each responding on a different timescale:
FCR (Frequency Containment Reserve) — primary reserve, responds automatically within 30 seconds to frequency deviation
aFRR (automatic Frequency Restoration Reserve) — secondary reserve, responds automatically within 5 minutes via the PICASSO platform, with setpoint signals every 4 seconds
mFRR (manual Frequency Restoration Reserve) — tertiary reserve, responds manually or semi-automatically within 12.5 minutes under MARI
Think of them as an escalating response: FCR is the first responder when frequency drifts, aFRR takes over for sustained imbalances, and mFRR handles large, prolonged deviations. All three are procured through open market mechanisms and run by the TSO under the EU Network Codes (EB-GL and SO-GL).
2. Trading Markets (matching supply and demand ahead of delivery)
These are the wholesale electricity markets where you actively buy electricity during low-price hours and sell during high-price hours. Two main products:
Day-ahead — hourly auction closing at 12:00 CET one day before delivery, coupled across Europe via SDAC
Intraday — continuous trading up to 5 minutes before delivery, in 15-minute blocks, via IDA auctions and continuous order books
Revenue comes from price spreads, not from holding capacity available. This is open to any participant with a flexible energy contract on the EAN code (no prequalification or telemetry needed). Futures markets exist for hedging months or years ahead but are not a meaningful revenue stream for battery storage.
3. Congestion Management (relieving local grid capacity constraints)
Sometimes a specific part of the grid (a transformer, cable, substation) runs out of capacity. Unlike frequency imbalance, which affects the whole synchronous area, congestion is local and regional. In the Netherlands, this is managed through GOPACS (Grid Operators Platform for Congestion Solutions), accessed via ETPA or directly via EPEX SPOT's IDCONS mechanism.
The mechanism works through paired actions: an asset inside the congested area reduces injection (or increases consumption), while another asset outside the area does the opposite. Together, they resolve the local constraint. Activation is event-driven and depends on available capacity and regional congestion signals.
Estimated revenue from each market
Wildly varying but most data can be accessed and used for your analysis
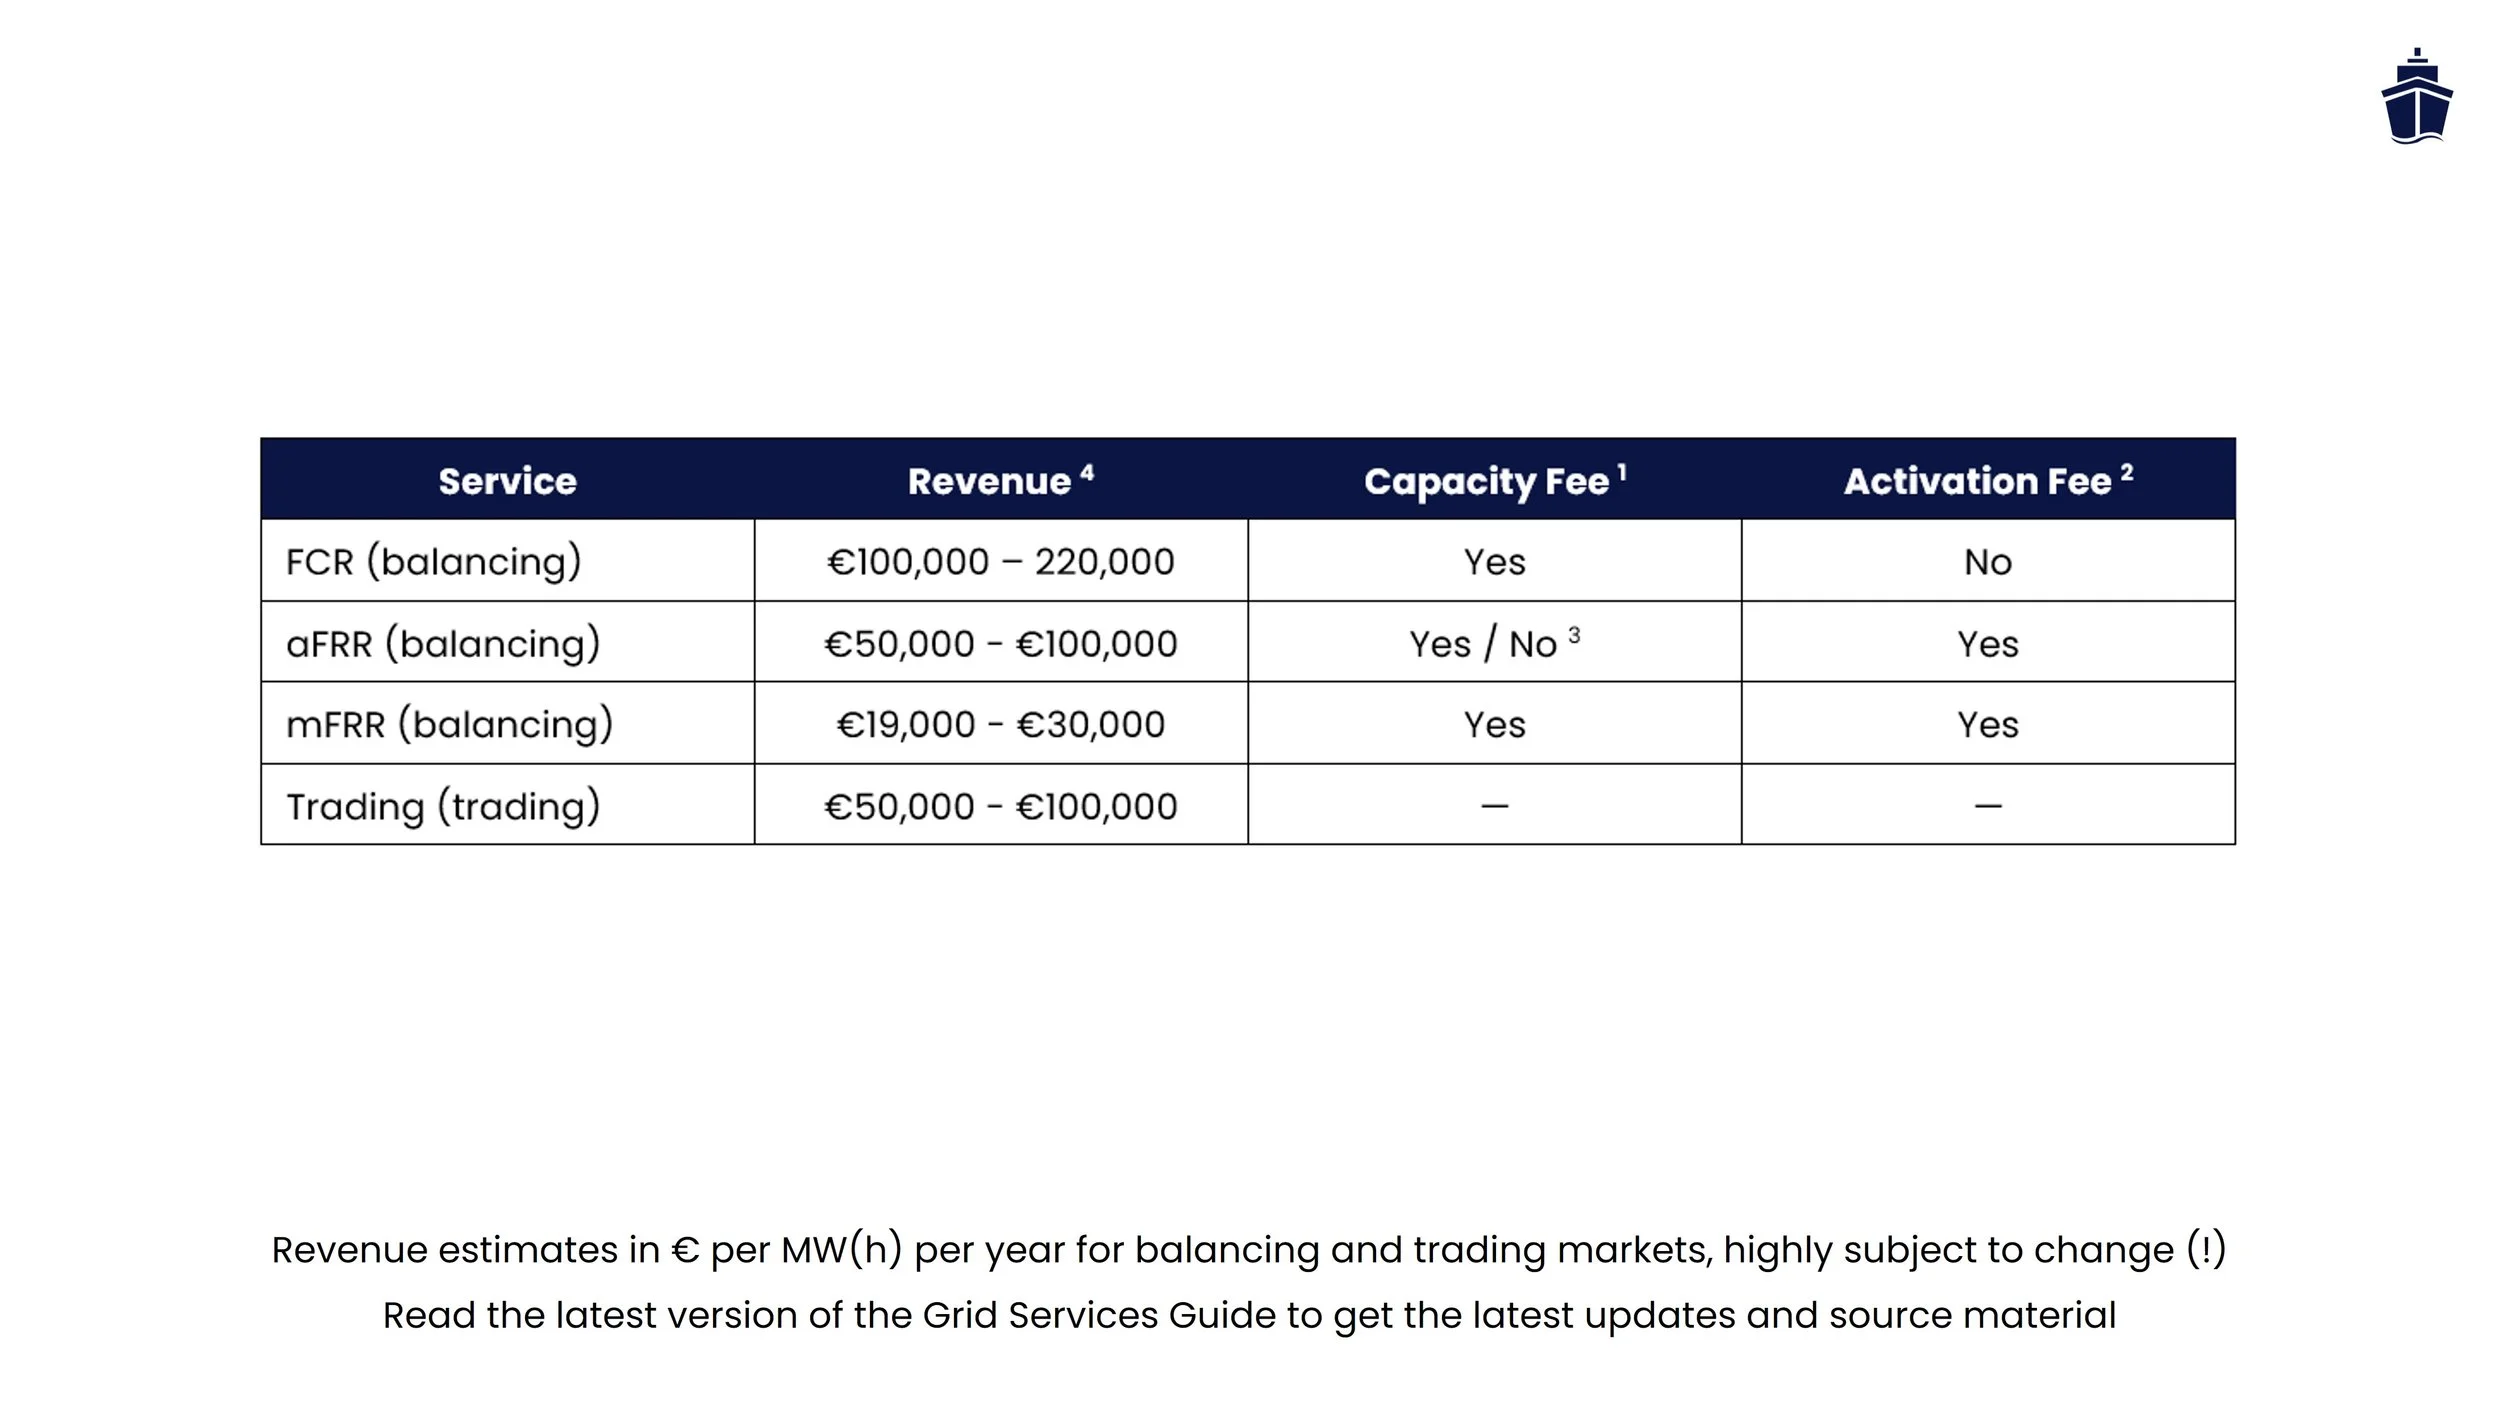
Revenue potential for all grid services varies wildly (a factor of 10 is not uncommon) and depends heavily on asset location, market conditions, and timing. Most detailed data from TSOs and operators is anonymized and available online in many cases. The ranges below are drawn from those public sources, field interviews, project experience and other and TSO transparency databases. In general a combination of aFRR and day-ahead trading yields the largest / easiest revenue. FCR was typically the highest grossing market, but this has changed due to a large amount of batteries coming online.
1. Balancing Markets
FCR (Frequency Containment Reserve): €100,000–€220,000/MW/year Capacity-based, with relatively stable monthly tenders. Has the tightest requirements of all balancing markets. Prices have trended downward since 2023 as battery prequalified capacity has scaled; expect 2024–2026 figures to be in the lower half of this range.
aFRR (automatic Frequency Restoration Reserve): €50,000–€150,000/MW/year Mixed capacity and activation fees. More volatile than FCR due to European cross-border coupling via PICASSO (since October 2024). Dutch aFRR bids now compete directly with German, Belgian, and Nordic capacity, pushing prices toward the lower end in high-wind or high-solar periods.
mFRR (manual Frequency Restoration Reserve): €19,000–€30,000/MW/year Lowest revenue, but minimal operational overhead. Activation is infrequent (roughly 30 times per year historically). Less relevant for most small-to-medium batteries, typically not worth investigating for OPS-related projects.
Note: All balancing figures are gross BSP (Balance Service Provider) revenue. Asset owners participating via aggregators (other services providers) typically receive 60–80% after fees and margins. These ranges reflect 2023–2024 data; regulatory changes and technology scaling will shift them over time.
2. Trading Markets
Day-ahead: €50,000–€100,000/MWh/year Revenue depends entirely on your ability to forecast hourly prices and manage charge/discharge efficiently. Typical margin is €30–€80/MWh on favorable days. Dutch market averaged around €60/MWh in 2023–2024, but intra-year volatility is extreme (€10/MWh in summer, €150+/MWh in winter peaks).
Intraday: €50,000–€100,000/MWh/year as an uplift over day-ahead The 10–30% revenue boost from intraday typically comes from shorter-term price moves and the ability to react to forecast errors. Requires active monitoring and automated execution. Less predictable than balancing, but higher ceiling in volatile markets.
Note: As of early 2026, Dutch electricity prices are lower and less volatile than 2021–2023, so intraday spreads have compressed; future data from your trading engine will be more reliable than historical benchmarks. Remains a game of chance, but high volatility typically means higher revenues to be had.
3. Congestion Management
GOPACS / Congestion relief: Activation fee per delivered MWh, typically €20–€150/MWh depending on severity and region Revenue is sporadic and location-dependent. Congested zones (red on the capacity map) may see 10–50 activations per year; uncongested areas may see none. Minimum participation size is 500 kW via ETPA.
Note: Congestion revenue is the hardest to predict. A port with chronic congestion (e.g., Amsterdam, Hamburg) could earn €20,000–€50,000/year; a port with adequate capacity will earn zero. Three things are important: location, location, location.
Strategic stacking: combining all three
The key insight is that these three markets are not mutually exclusive. A battery can participate in multiple markets simultaneously, allocating capacity strategically to whichever offers the best return on any given day or hour.
Example of a dynamic BESS strategy (Monday, typical winter day):
06:00–12:00: Run FCR (high capacity fees, steady revenue, minimal cycling stress)
12:00–18:00: Run intraday trading (price spreads are usually larger during midday demand swings; sell high as industry ramps up)
18:00–midnight: Run aFRR capacity contract (evening peak demand increases aFRR clearing prices)
This kind of dynamic stacking can push total annual revenue for a large BESS from a single product (say €150,000/MW from FCR alone) to €250,000–€350,000/MW or more by combining products strategically. The tradeoff is operational complexity: you need real-time monitoring, automated bidding systems, API integration with TenneT, EPEX SPOT, and potentially ETPA, and continuous coordination across multiple platforms.
Important caveat: These figures are based on 2023–2024 market data. By the time you read this, regulation, battery deployment volumes, and wholesale electricity prices will have shifted. Always run a site-specific economic model using current TSO settlement data and your actual asset location before committing capital.
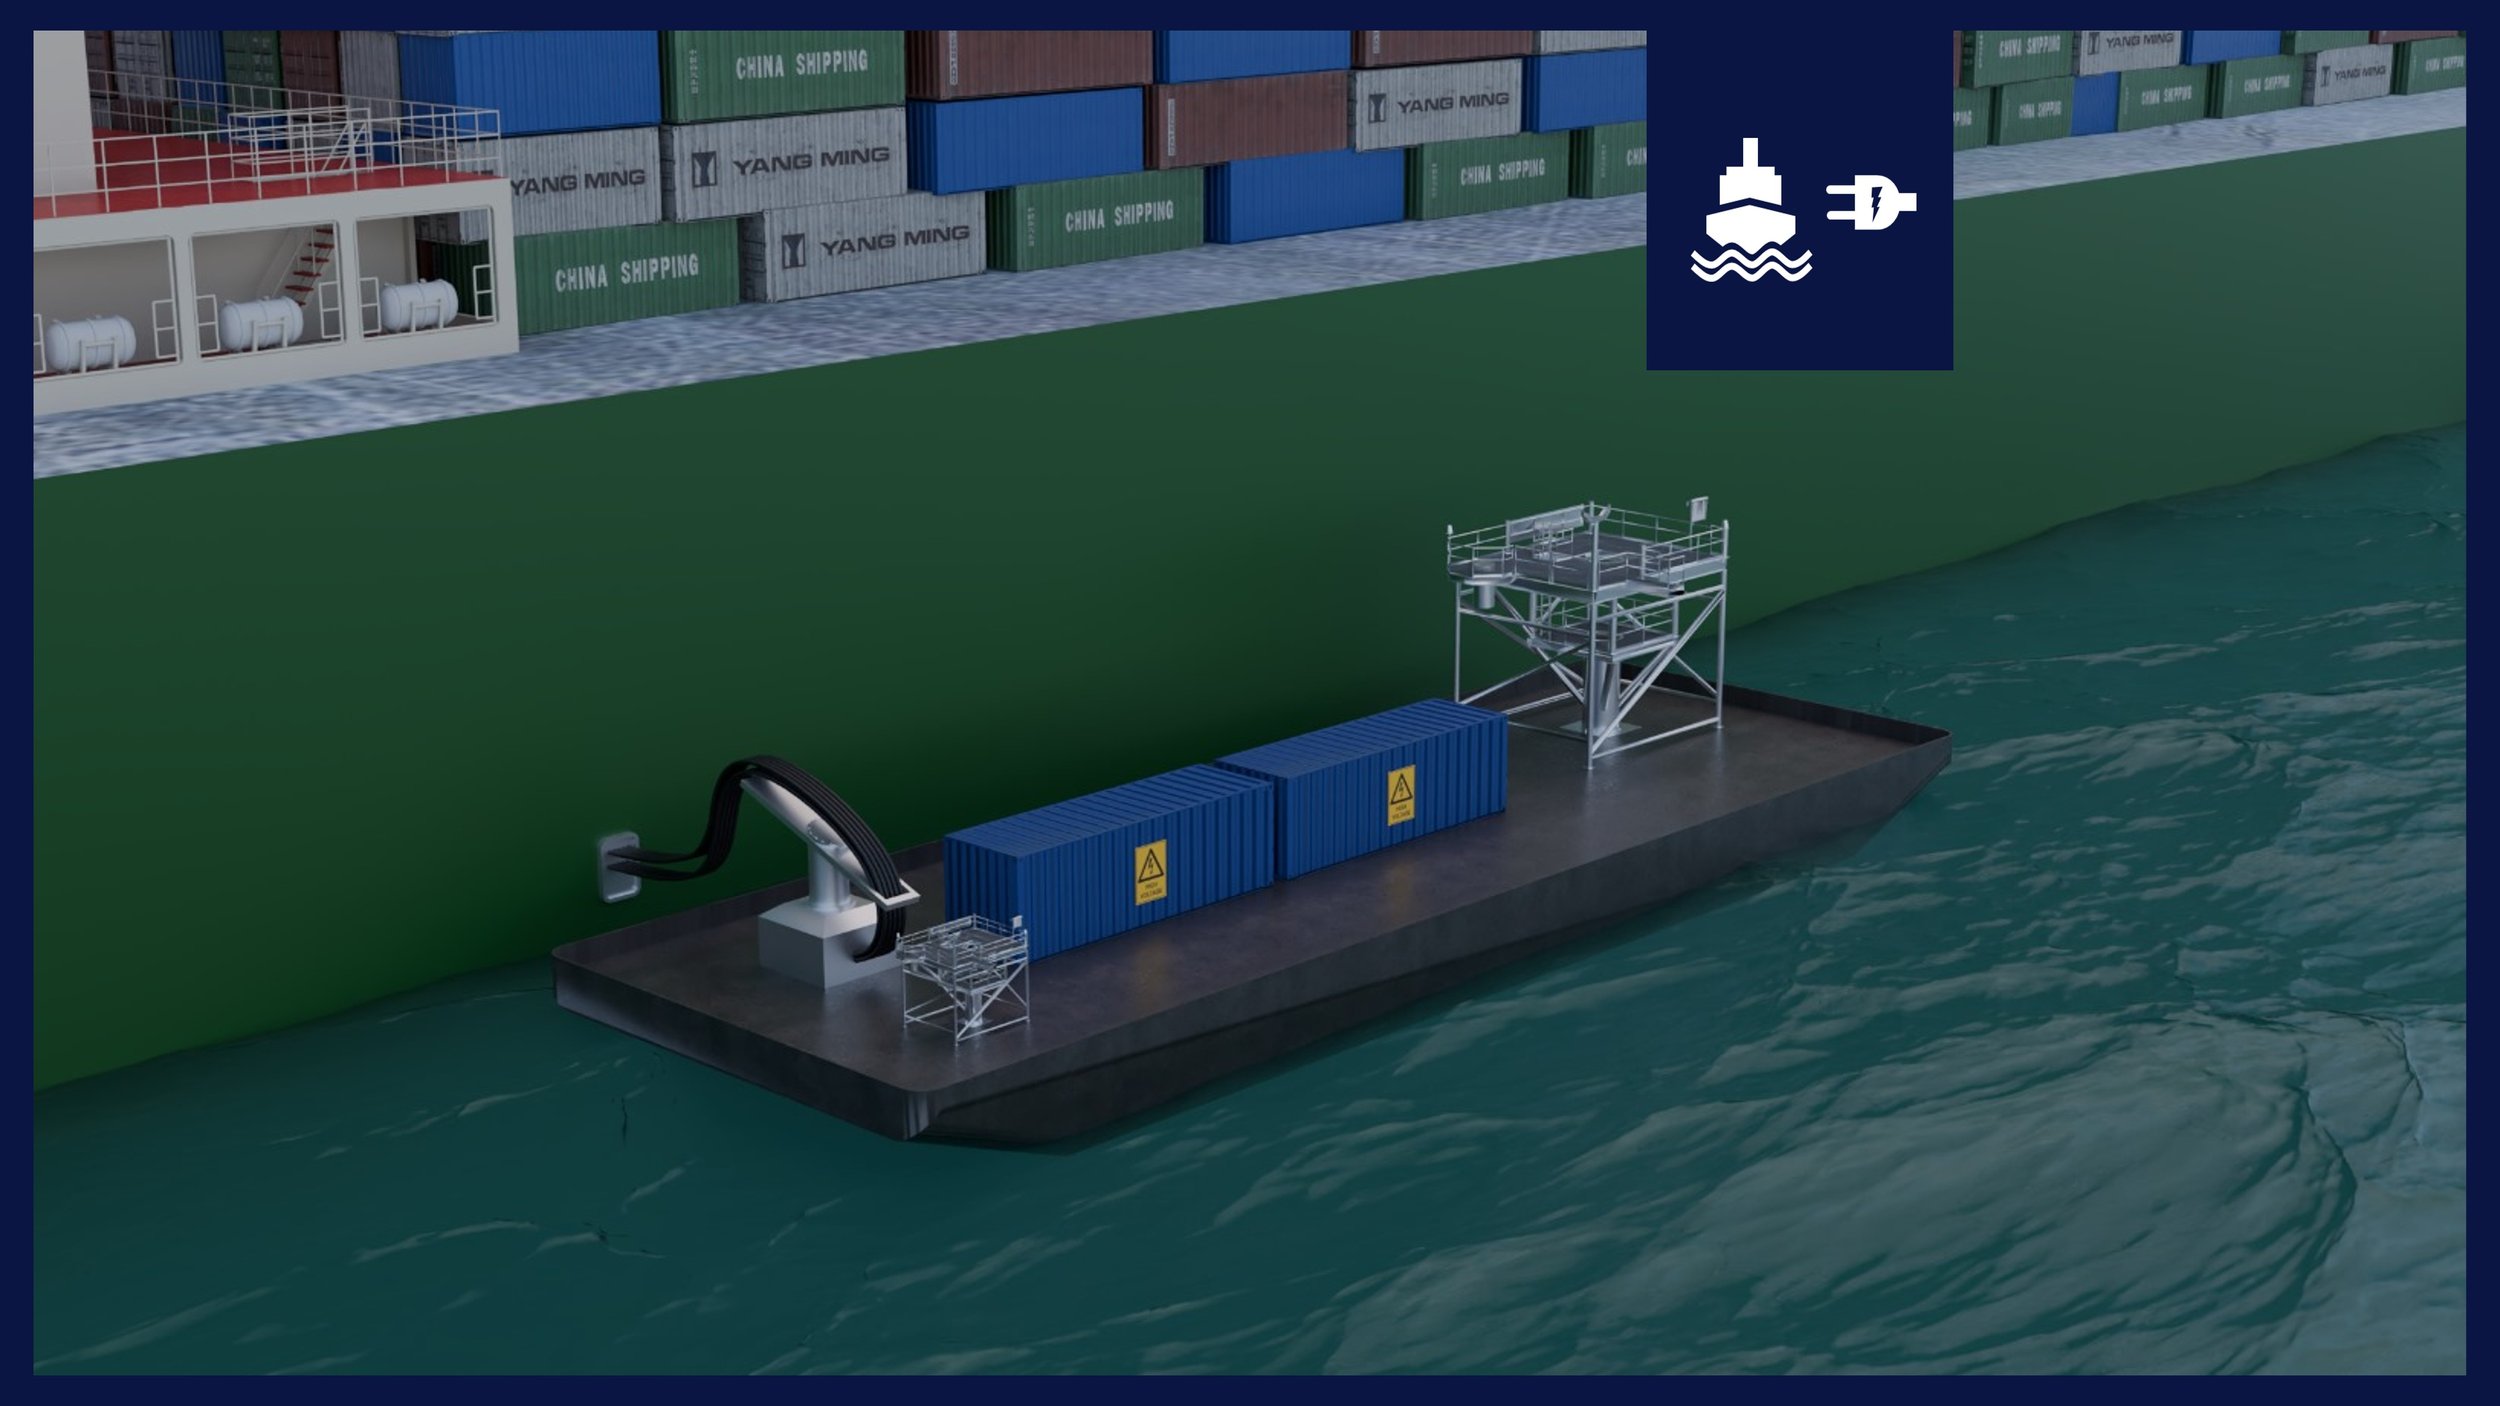
How this could improve your (Onshore Power Supply) business case
When the ship is not using your shore power installation, you can still make money!
Instead of letting a 5–10 MW OPS transformer run unused during low-shipping periods, you can commit that capacity to the grid's balancing reserves and earn a guaranteed monthly fee—regardless of whether a ship plugs in or activation is called. This creates a predictable second revenue stream that improves the OPS project economics without cannibalizing your core shipping business. Three revenue streams, ranked by relevance to port operators:
Stream 1: Balancing Markets (capacity-based revenue)
You commit to hold a certain amount of power available (in MW), and you're paid a fee for that commitment, regardless of whether the TSO actually activates you.
FCR (Frequency Containment Reserve) is the simplest entry point. You bid your available capacity into daily auctions on regelleistung.net. Prices are published in real-time; recent historical prices average €10–€20/MW/hour, which annualizes to roughly €100,000–€220,000/MW/year for a fully prequalified, continuously available asset. Prices fell sharply between 2022 and 2024 as battery storage scaled; further declines are possible if storage overbuild continues. For a 5 MW OPS installation, this translates to €500,000–€1.1 million per year in gross balancing revenue, though net returns depend on prequalification costs and aggregator fees (typically 15–25% if you use a third-party BSP).
aFRR (automatic Frequency Restoration Reserve) adds an activation component. You're paid both a capacity fee (for standing ready) and an activation fee (for delivered energy, €/MWh). Since October 2024, aFRR pricing via PICASSO has tightened to European merit orders, compressing capacity fees significantly. Total revenue is typically €50,000–€150,000/MW/year, split between capacity and activation. Less stable than FCR, but useful as a backup if FCR auctions fail to clear your full bid.
mFRR (manual Frequency Restoration Reserve) is least relevant for port operators because the 20 MW minimum (being phased to 1 MW under MARI) rules out most OPS installations, and activations are infrequent (~30/year historically).
Operational requirement: Prequalified assets must be available continuously and respond within contracted parameters. Failure to deliver incurs penalties of €2,000–€10,000/MWh shortfall. For battery-based OPS systems, this means real-time State of Charge management and sub-second TSO communication. For assets with natural inertia (fuel cells, flywheels), requirements are less stringent.
Stream 2: Trading Markets (energy-based revenue)
Instead of committing capacity, you can opportunistically buy low and sell high. Revenue comes from price spreads, minus efficiency losses (8–15% for battery round-trip), grid fees, and imbalance costs.
Day-ahead is the most liquid venue. You bid your willingness to buy or sell for each hour of the next day at a specified price. After 12:00 CET D-1, the exchange clears all bids at uniform prices. Typical spread between solar-heavy midday (€10–€30/MWh) and evening peak (€80–€150/MWh) in current market conditions is €30–€60/MWh in low-volatility periods. A 5 MW OPS installation running one charge-discharge cycle per day could realistically earn €50,000–€100,000/year from day-ahead arbitrage alone.
Hidden cost: battery degradation. Every charge-discharge cycle degrades the battery. Day-ahead arbitrage typically runs one full cycle per day (~250 cycles/year), which reduces effective revenue by 15–25% after warranty degradation is factored in. This is often overlooked in initial ROI models. If your OPS uses lead-acid or flow batteries, degradation is lower; lithium-ion requires more conservative return assumptions.
Intraday lets you correct day-ahead forecast errors before settlement. Continuous trading means prices update throughout the day. Revenue is typically 10–30% uplift over day-ahead, useful as a hedging tool rather than a primary source.
Operational requirement: You need real-time price monitoring, automated trading systems, and accurate demand forecasts (ship arrival schedules feed into this). Forecast errors lock you into unfavourable trades.
Stream 3: Congestion Management (activation-based revenue)
Paid only when the grid calls you to reduce injection or increase consumption in a congested area. Revenue is sporadic and location-dependent. In the Netherlands, GOPACS coordinates congestion relief through paired bids. Payment is per activated MWh, typically €20–€150/MWh depending on severity. A port in a chronically congested substation area (e.g., Rotterdam, Amsterdam) might see 20–50 activations per year; isolated ports see none. Minimum participation size is 500 kW via ETPA.
Sign up for premium tools and benefits
Premium tools and expert support at your fingertips
The Grid Services Guide provides a structured reference for navigating the markets that determine battery storage revenue across Northwest Europe. Drawing on TenneT, ENTSO-E, EPEX SPOT, GOPACS, and the EU Network Codes (EB-GL, SO-GL, RfG), the guide documents the three main grid service categories balancing, trading, and congestion management and sets each market side-by-side with its technical requirements, revenue mechanics, and access models, showing where opportunities lie, where the constraints bind, and what the differences mean for asset economics.
Use Apple Pay to purchase the Excel (only on iPhone) - contact helpdesk for payment by invoice
Don’t want to sign up? Check pay-per-use options


This FAQ provides essential answers on grid balancing markets (FCR, aFRR, mFRR), trading markets (day-ahead, intraday), and congestion management. Covers prequalification timelines, revenue ranges, operator roles, technical requirements, and more. It is intended for developers and asset owners in Northwest Europe.